

The new 6.0 update on Telegram finally introduced a long-anticipated feature – built-in channel statistics. Before it was only possible to view and analyze data with the help of external services.
The statistics allow you to see the information about the reach, the followers’ peak activity, viewing sources, and other criteria. You can find more details below in our article.
How to view internal statistics of a Telegram channel?
The statistics are only available for administrators of the channels with more than 1,000 followers. To view the information, the administrator should be authorized to make posts.
The feature is available both for iOS and Android. To view the statistics in the Android app, click on your channel profile, find the horizontal dots menu, and choose “Statistics”.
<
div class=”d-flex justify-content-center”>
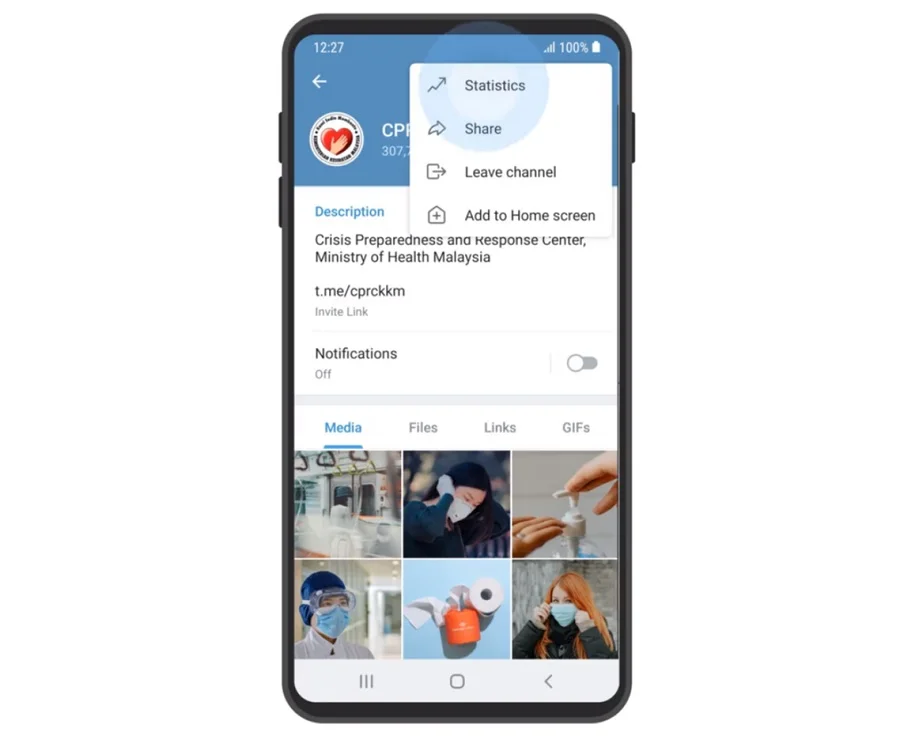
iOS users should click “More” in the channel profile and then choose “Statistics” from the list.
Once you opened the section, you will see the overview of the major metrics for the last seven days. It has information about the followers, views, post sharing, and the percentage of enabled notifications.
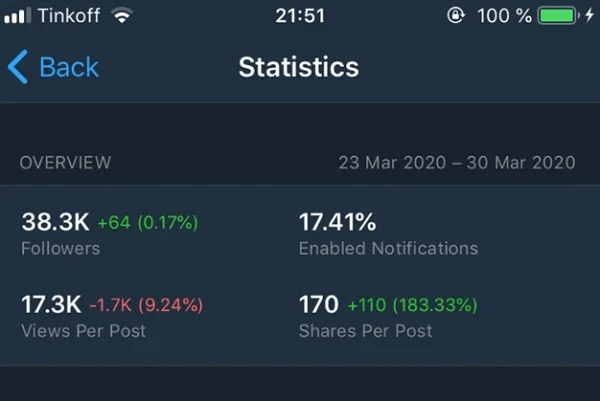
The overview section cannot be adjusted. You cannot view details about each metric. To do so, you will need to open separate sections for specific metrics.

Onlypult posts to all social media platforms, provides analytics data, builds teamwork and saves you time.
What do Telegram in-built statistics show?
The built-in statistics of the messenger consist of 10 graphs.
1. Growth
The growth graph shows fluctuations in the number of followers on your channel. It allows evaluating dynamics of the channel development and tracks fast growth or decline. Besides, it shows when the numbers reach their absolute maximum, etc.
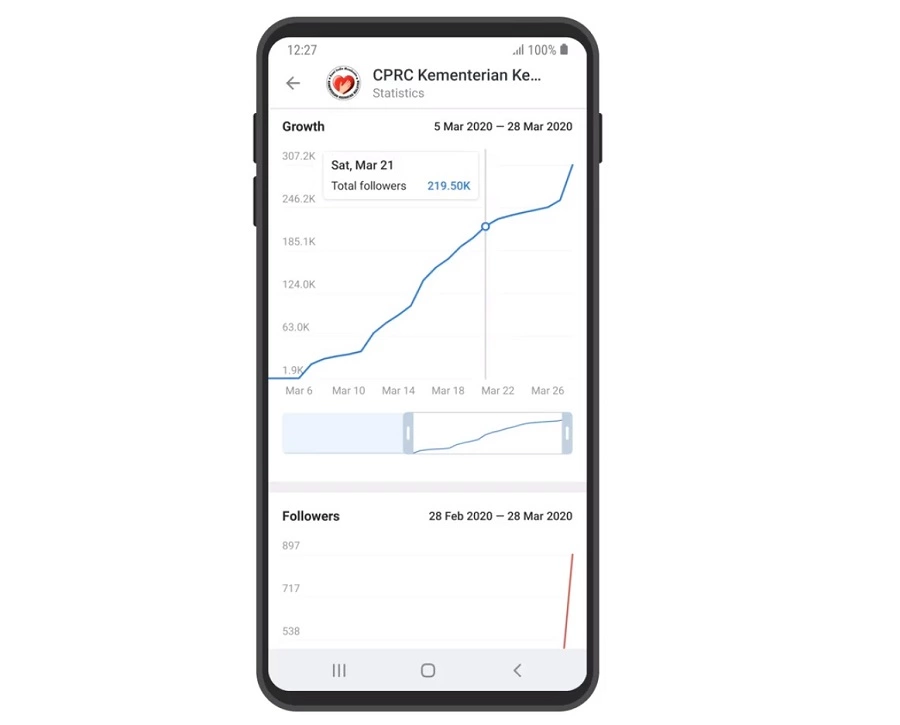
The graph has a time scale with a slider that allows you to choose a period. The minimum period is 10 days, the maximum is half a year. If you click the graph, you will see the daily statistical data.
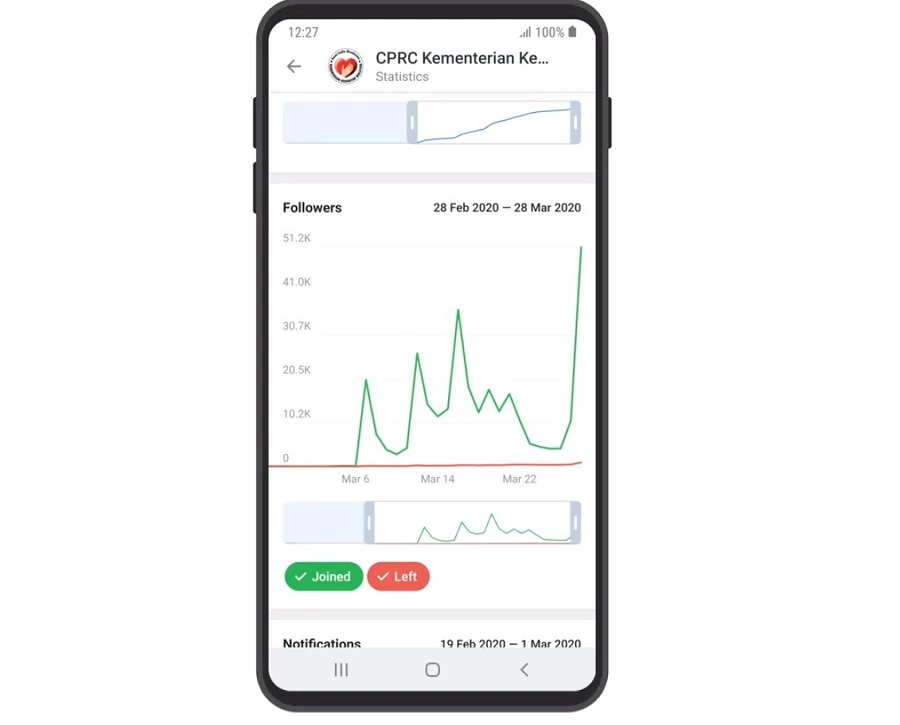
2. Followers
The Followers graph shows the information on the number of people who followed and unfollowed your channel. The maximum period is half a year. You can see detailed daily reports on new and unsubscribed followers. You can display both graphs or only one of them in the Statistics section.
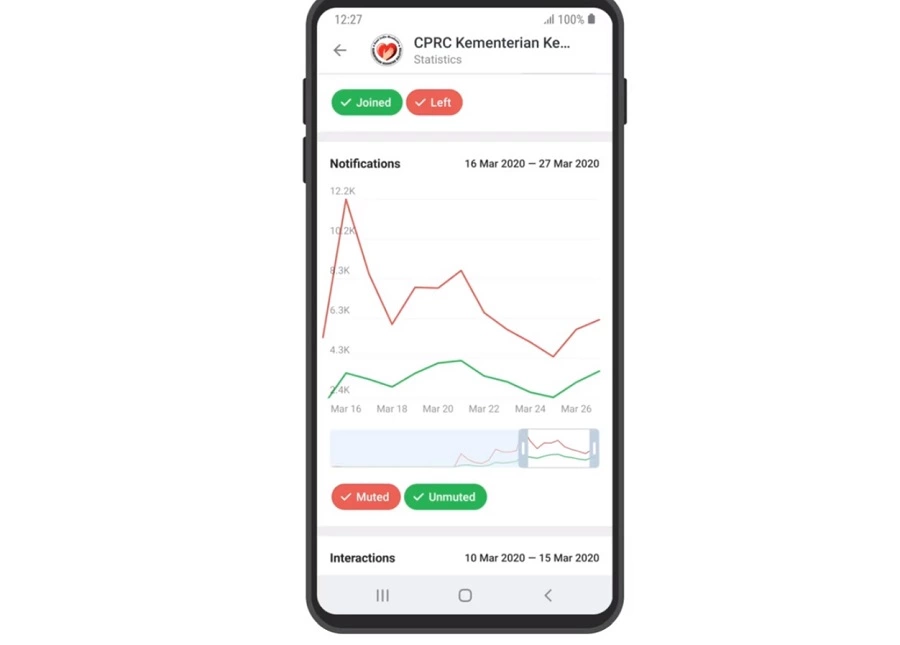
3. Notifications
The graph demonstrates the number of users who have enabled or disabled the channel’s notifications. You can try to analyze after what posts people disable notifications, and what posts, instead, motivate the users to enable them, and after how many posts people tend to “mute” the channel, etc.
Don’t get upset if most of your followers prefer to mute your channel. Most often it has nothing to do with the content – it is just more convenient for the users not to be distracted and read posts when they have free time.
4. Views per hour
With the help of the following graph, you can track the time of the day when your posts are most actively viewed. Here you can also find an average weekly rate. There are two lines on the graph: one depicts the information about the current week, the other one – about the last week.
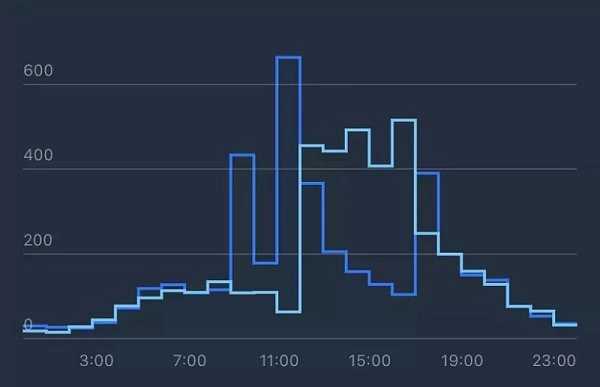
With the help of the graph, you can compare the results and decide when to make the publications. Please note that the default time is UTC (Coordinated Universal Time).
5. View sources
With the help of the “View history” graph, you can find out how Telegram users see your publications.
There are 6 sources as follows:
- Followers – users who see your posts on your channel
- Channels – users who see your posts on other channels
- URL – views after following the link to your post
- Groups – views you get, after your publication was reposted to a group
- Private chats – reposts to chats
- Search – search result views
The graph shows the result of the post promotion. It also shows if your post has gone viral and is actively added to chats and groups.
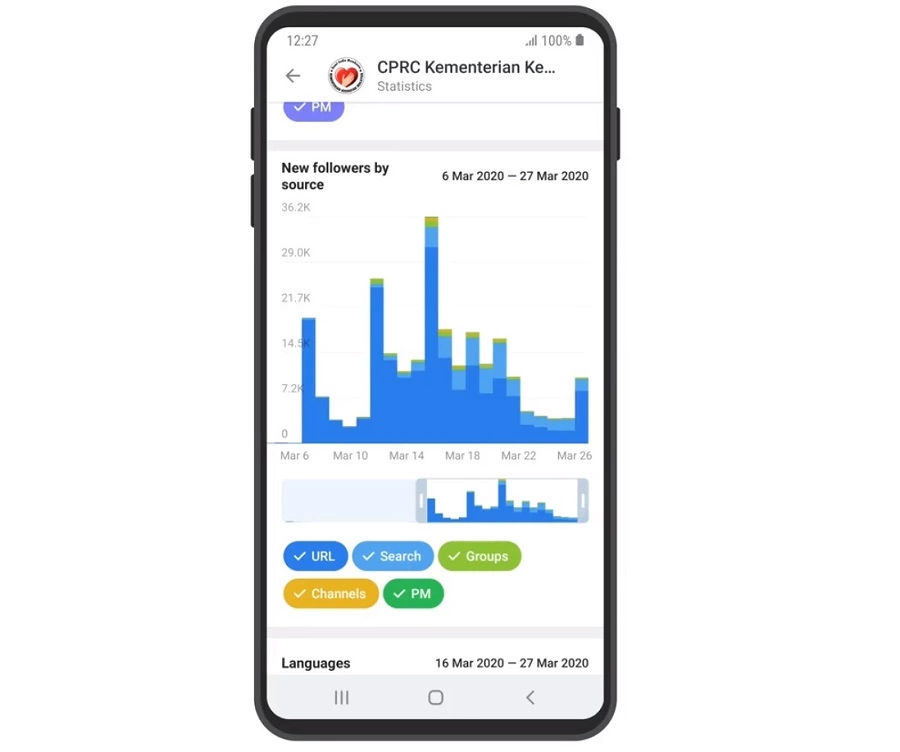
6. Followers by source
This graph is similar to the previous one but it only analyzes the users who have just started following you. The sources are channels, groups, chats, links, and search requests.
7. Languages
Here you can find out what interface language is installed on your users’ Telegram. The data is presented in the form of a diagram. You can deactivate some languages and view daily and weekly statistics.
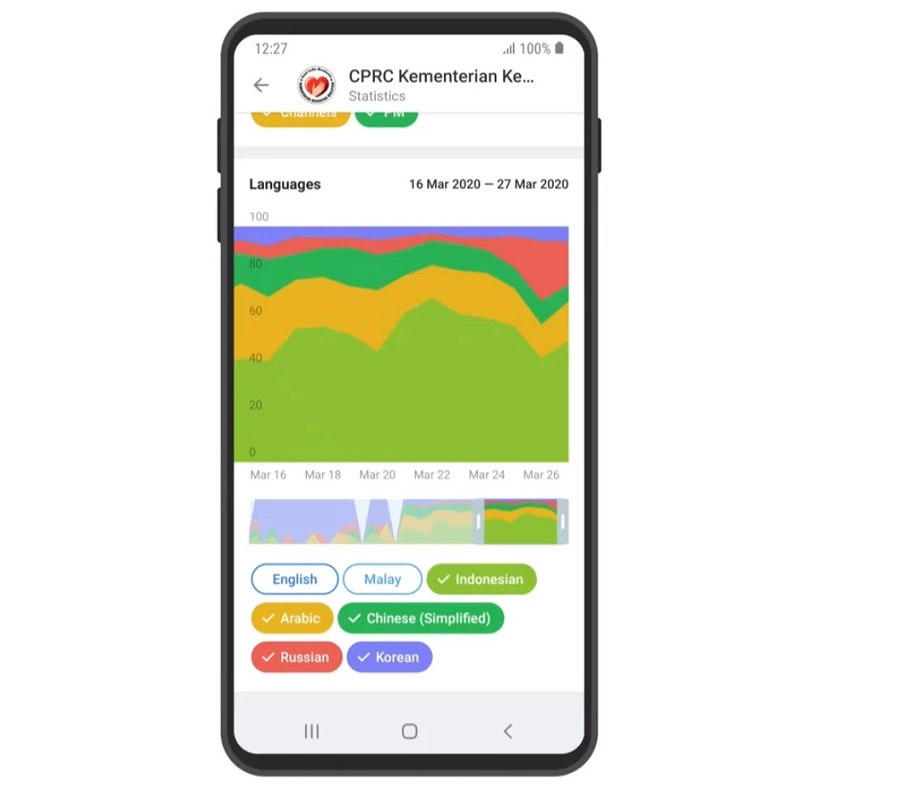
With the help of this diagram, you can indirectly determine the location of your followers. International users can also use an English app version, meaning that it won’t help you to locate your audience.
8. Activity
This graph helps you to evaluate the activity of the users interacting with your channel. There are two related metrics: views and reposts.
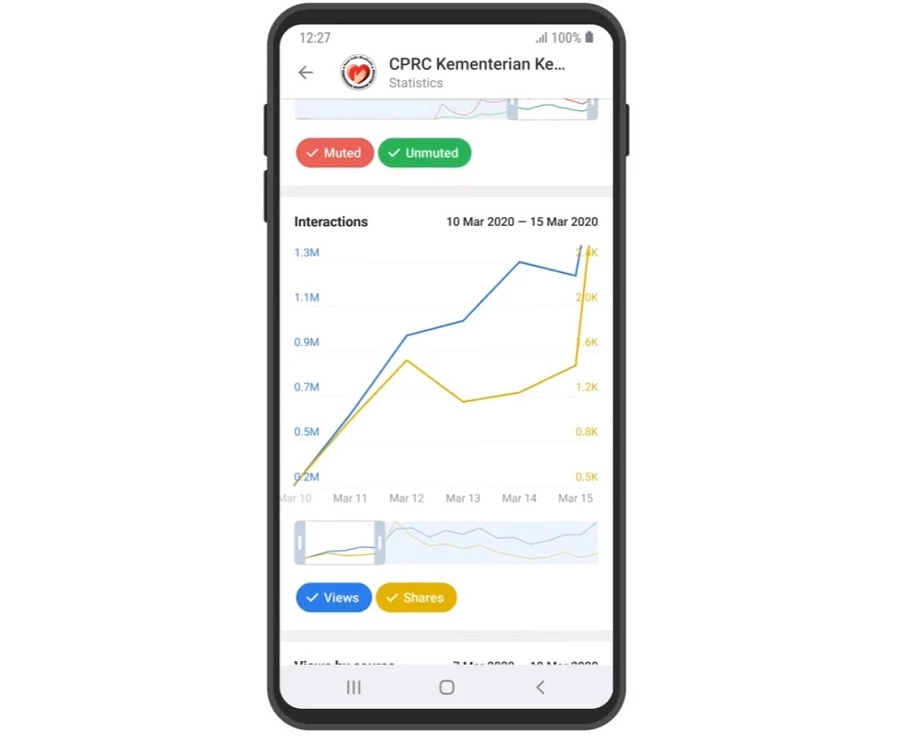
By default, you will see the data for the last week. The maximum period you can view is 4 months. You can easily change the period by moving the slider.
9. Activity on InstantView (IV)
A separate graph shows activities on InstantView. They are instant-view articles, for example, materials generated through telegra.ph. The information is displayed according to the views and reposts directly from the IV pages. If you don’t post such articles, the statistics field will be empty.
10. Recent posts
There is a separate graph for the reposts and views of recent publications. The maximum tracking period is one week. If you click a certain post, you will see a detailed statistical report.

With Onlypult, save time you spend on SMM tasks — posting to all social media, analytics, multiple links, micro landing pages, web monitoring. All in one place.