Form a strategy with social network analytics and achieve the best results!

Try an effective social media management tool to achieve better performance.
These brands are already working with our platform


Common metrics
Choose important metrics and create an individual dashboard. Keep track of only the necessary data and do not be distracted by unnecessary things using our analytics tool.
- easily customizable dashboard
- only the necessary metrics to achieve your goals
- all important information on one page

For convenience, you can select the specified period settings: the last 7 days, the previous week, the previous month, the last 30 days, the previous year, this year, all the time, or choose your personal period.
- configurable date range
- personal period selection
- display for a day, week, or month
- uploading data for a period of up to 10 years

Interactive charts will help you visually see the rise and development of the company. Based on this data, it is possible to identify growth points for a business and track patterns.
- ease of understanding
- advanced analytics
- the ability to export
- tooltips

No more boring and incomprehensible tables. Export submit an analytical report on social networks in PDF or Excel formats to customers or the marketing team. Specify emails and automate the process by setting the mailing time.
- automated distribution of reports
- social media analytics and reporting
- personalized reports ready for presentation
- adding your company's logo


Audience Analytics
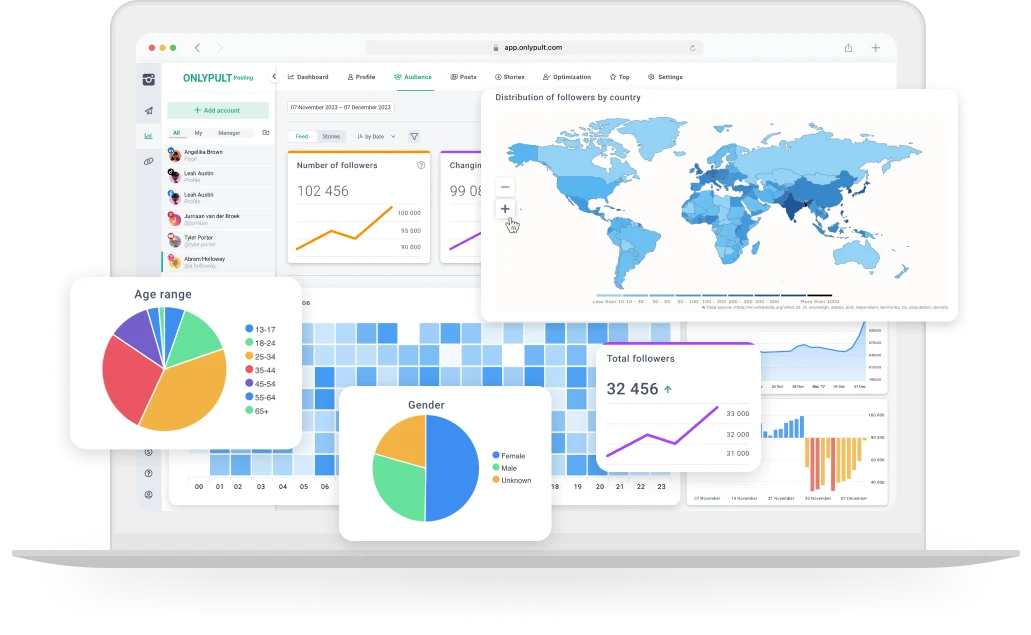
Thanks to daily monitoring of subscriber growth and outflow, you can make timely changes to your business strategy and be one step ahead of your competitors.
- data updates every hour
- tracking subscriber growth
- analyze which advertising campaigns are increasing the audience

Presenting social media data in the form of visual graphs will simplify the work and allow you to track even small changes among the audience. By tracking social media metrics, you can get to know subscribers' needs and tastes even better.
- tips for all social media metrics
- percentage of data
- simple and clear charts

Gradually, Analytics generates data on the best days and hours of publications. The more posts there are, the more accurate the data. The tables show at what time the largest number of subscribers will see the content.
- audience activity time
- color intensity as an indicator of the best time
- the best day of the week and the best publication time

Find out more about your target audience: where they come from, what languages they speak, which demographic group they belong to, where they live and what they are interested in.
- charts of the top 10 countries and top 10 cities
- representation in the form of a map
- gender and age of subscribers
- displaying data in the form of a map


Posts metrics
Stop guessing on the coffee grounds, use the analytics of publications to form a strategy on social networks. By viewing information on one or more types of content, you can see the data of subscriptions and unsubscriptions regarding published posts and find out which type of content the audience likes the most.
- it is easy to identify the interests of the audience
- filter by publication type
- building a social media presence strategy based on content data
- analyzing comments for different types of content

It contains all the key data needed to evaluate activity on social media accounts. Find out if the posts are being reviewed, how many people came to see the new posts and what content they were interested in.
- impressions chart for different types of posts
- average reach over the selected period
- percentage of maximum and average reach
- the number of views of all publications

Detailed analysis of stories with data on impressions, reach, and interactions will help you draw conclusions about which content is best published.
- the stories that your subscribers love the most
- all the data about the views: the number of exits, scrolls, and so on
- percentage of content viewability
- interaction analysis: the number of likes, comments and reactions to each story

Videos are the leader of content in social networks, so it is important to analyze not only by basic metrics. With our analytics, you will always know which video posts bring in more subscribers and which ones gain more reach.
- when and how users watch videos
- the number of views in a given period
- separation into videos and reels
- displaying the period with the most videos

Stop wasting time creating content that no one is interested in. While competitors randomly post posts, you can analyze all interactions and quickly make informed decisions based on this data.
- interaction charts for the selected period
- schedule of saving to Favorites
- draw conclusions based on the percentage of interactions
- segmentation of interactions by type of content: video, photo, text


Optimization
Find out which type of publications were used most often — photos, gallery, videos or reels — and which type of content is most in demand from the audience.
- find out which videos, images, or text work best
- data on social trends
- creating only relevant content
- the interests of the audience in the selected time period

The section contains detailed analytics on the frequency and density of publications, by day of the week and by hour. It is possible to track how many interactions took place on selected days.
- the largest and smallest number of posts per day
- the most frequent publication time
- the most frequent day of posting
- the number of interactions for each day of the week

Working with hashtags: help in selecting and analyzing the coverage of posts. Use a social media management and Analytics tool to identify hashtags that can increase the number of views.
- use only successful tags
- tracking the effectiveness of hashtag posts
- get your posts to the top with the right hashtags
- determine the optimal number of hashtags for different types of publications

Find out which type of publications were used most often — photos, gallery, videos or reels — and which type of content is most in demand from the audience.
- find out which videos, images, or text work best
- data on social trends
- creating only relevant content
- the interests of the audience in the selected time period

Find out on what day of the week and at what time it is best to publish stories that the audience will definitely see and appreciate. Publish content that will be of interest to subscribers.
- data on the format of stories that subscribers like
- determining the frequency and density of publications
- charts with popular content types
- the best publication time


What our customers say about us
Frequently Asked Questions
Join our team and get 7 days of free access


