Build your strategy with social media analytics and achieve higher goals!

Try an efficient social media management tool to get better results.
These brands are already working with our platform


GENERAL METRICS
Choose crucial metrics and create your dashboard. Using our analytics tool, track only necessary data and do not get distracted by unwanted things.
- easy-to-use dashboard
- only necessary metrics to hit your targets
- all vital information on one page

Using the social media analytics tool, you can configure the data analysis period however you want: for one day or all time. You can get a chart with an advertising period or campaign data easily.
- time range selecting
- personal period selection
- showing daily, weekly, or monthly data
- exporting data for 10 years

Interactive charts will show you how your brand is developing. You can track engagement, impressions, views, clicks, link clicks, audience behavior, popular posts, and other crucial metrics.
- ease of understanding
- advanced data analytics
- 60+ widgets
- pop-up hints

No more bland and tricky charts. Export social media analytics reports in PDF or Excel, ready for presentation. You can add several e-mails, e.g., your marketing team members. Set e-mailing time for social media promotion reports.
- choosing not only a file format but also sections for reports
- social media analytics and reporting in one feature
- reports ready for presentation
- adding a company logo


ANALYSING THE AUDIENCE
Thanks to daily monitoring of follower growth and decrease, you can alter your business strategy promptly and be one step ahead of your competitors.
- hourly data renewal
- follower growth monitoring
- understanding what campaigns make your audience grow

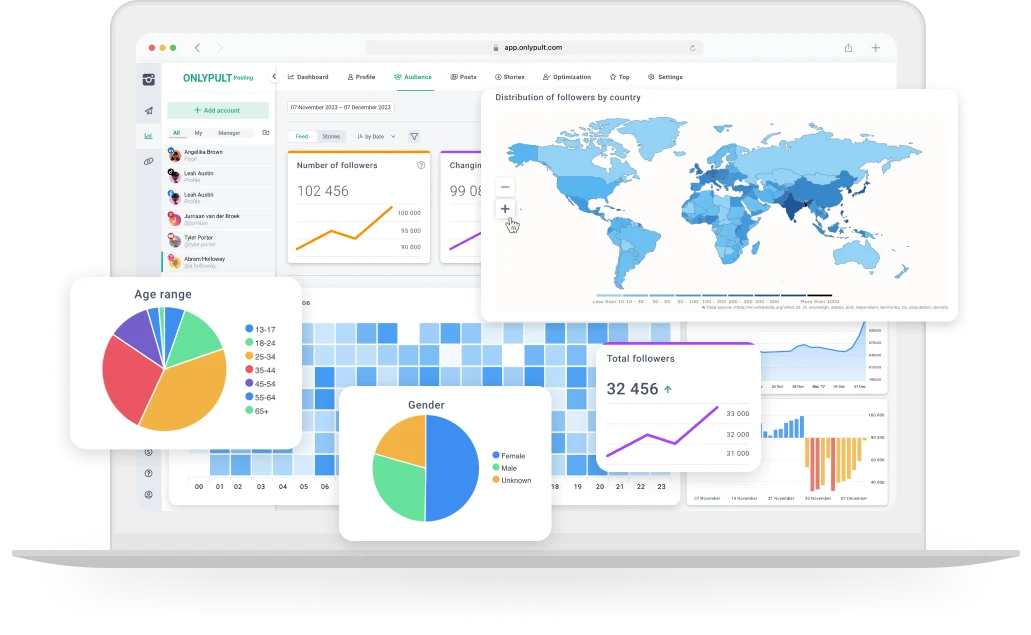
Displaying social media data as illustrative charts will simplify your work and allow tracking even the slightest changes in your audience. By monitoring social media metrics, you can understand your followers’ necessities and preferences better.
- social media metrics hints
- data percentage
- simple and easy-to-understand charts

Gradually, data about the best time and days to post will appear in Analytics. The more posts you have, the more accurate the data will be. The tables will show you when most of your followers see the content.
- audience activity time
- color intensity to show the best time
- best time and day of the week to post

Learn more about your target audience: where they are from, what languages they speak, what demographic group they belong to, where they live, and what they are interested in.
- top 10 countries and cities charts
- map view
- follower gender and age
- data map view


Posting data
Stop reading tea leaves — use posting analytics to build your social media strategy. Looking through information on one more content type, you can see data on followers and people who unfollowed you regarding published posts and understand what content the audience loves best.
- determining the interests of the audience easily
- applying posting filters by post types
- building a social media strategy based on content data
- analyzing comments for different content types

Here, you can find all the necessary data to assess activity on social media accounts. Learn if the audience views your posts often, how many people started following you when they saw new posts, and what content drew their attention.
- impressions chart for various types of posts
- average reach for the selected time range
- the percentage of the maximum and average reach
- total views on all posts

Detailed Stories analysis containing data on impressions, reach, and interactions will help you understand what content to post best.
- Stories your followers like the most
- all data about views: number of exits, scrolls, etc.
- the percentage of the content watched to the end
- interaction analysis: number of likes, comments, and reactions to each Story

Videos are the most popular on social media, so it is vital to use not only crucial metrics for analyzing. With our Analytics, you will always know what video posts bring more followers or provide higher reach.
- when and where users watch videos
- number of views for the selected time range
- separate video and Reels analytics
- showing the period with the highest number of videos

Do not waste time creating bland content. While your competitors post randomly, you can rapidly analyze all interactions and make sound data-based decisions.
- interaction charts for the selected time range
- saves to Favourites chart
- drawing conclusions based on the percentage of interactions
- interaction segmentation by types of content: videos, photos, tex


Optimization
If you know when your audience is most active, you can easily schedule social media posts. In this case, most users will see the content and interact with your posts.
- getting recommendations for boosting your reach
- analyzing published posts according to interaction with them
- scheduling posts only for the right time
- engagement audience analytics

The section has detailed analytics on posting density and frequency by days of the week and hours. You can track the number of interactions on particular days.
- the highest and lowest daily number of posts
- the most popular time to post
- the most popular day to post
- the number of interactions during every day of the week

Working with hashtags: help with choosing and analyzing post reach. Use the social media management tool and Analytics to find hashtags that boost your views.
- using only relevant tags
- tracking posting efficiency according to hashtags
- getting your posts to the top with relevant hashtags
- defining the relevant number of hashtags for different post types

If you know when your audience is most active, you can easily schedule social media posts. In this case, most users will see the content and interact with your posts.
- getting recommendations for boosting your reach
- analyzing published posts according to interaction with them
- scheduling posts only for the right time
- engagement audience analytics

Learn what day of the week and time are the best to post Stories that the audience will see and appreciate. Post content interesting for your followers.
- data on the Stories format your followers like
- defining posting frequency and density
- popular content type charts
- best time to post


THEY TALK ABOUT US:
Frequently asked questions
JOIN OUR TEAM AND GET A FREE 7-DAY TRIAL


