
We have launched new Analytics for Instagram business accounts and content authors. This updated tool opens up new ways to obtain helpful information about your audience, helps to adjust and optimize your promotion strategy, and provides readable reports on the work done.
Core advantages of Onlypult Analytics
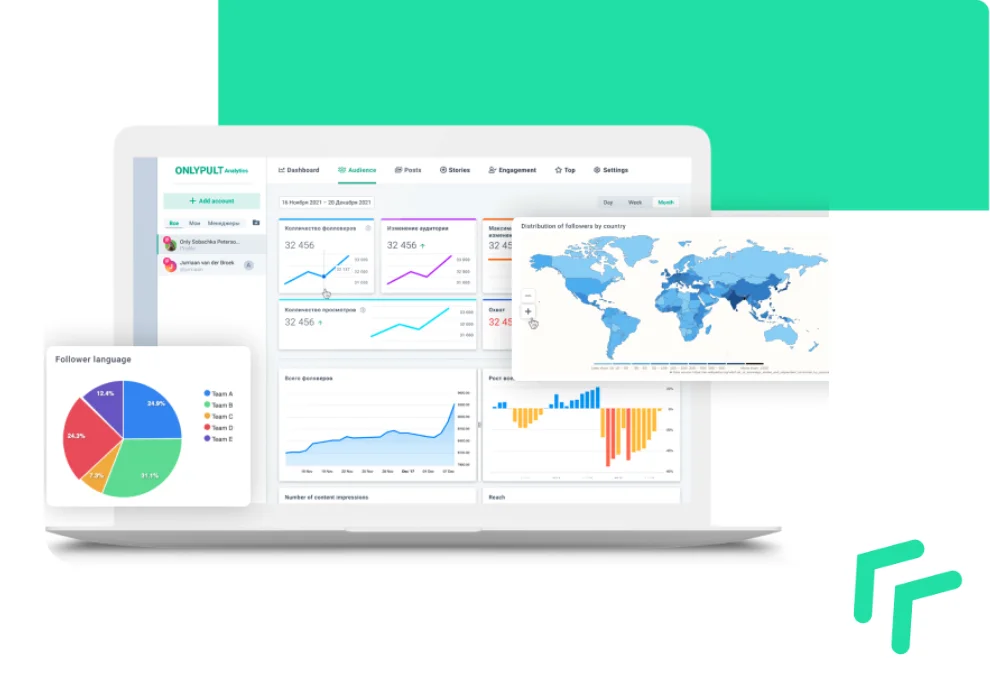
- Customized charts. You select parameters for collecting statistics in the sections Profile, Audience, Posts, Stories, and Optimization and get the entire picture on the dashboard. Detailed information is in the sections. You can drag and drop charts and arrange them in a convenient order.
Our graph set and display options are more convenient than the standard Instagram statistics.
- Analytics is a part of the platform. It is free of charge if you are already an Onlypult user.
- You can grant access to clients and colleagues; use the Team section or share it right in the Account Settings.
- XLS and PDF reports. We are planning to add PPTX soon. You can also add corporate identity elements to reports, for example, a logo.
- The latest 10 thousand posts from your Instagram account are available. It is convenient if you want to analyze statistics over a long period.
Analytics Sections
Let us briefly go through the sections to learn the new tools better.
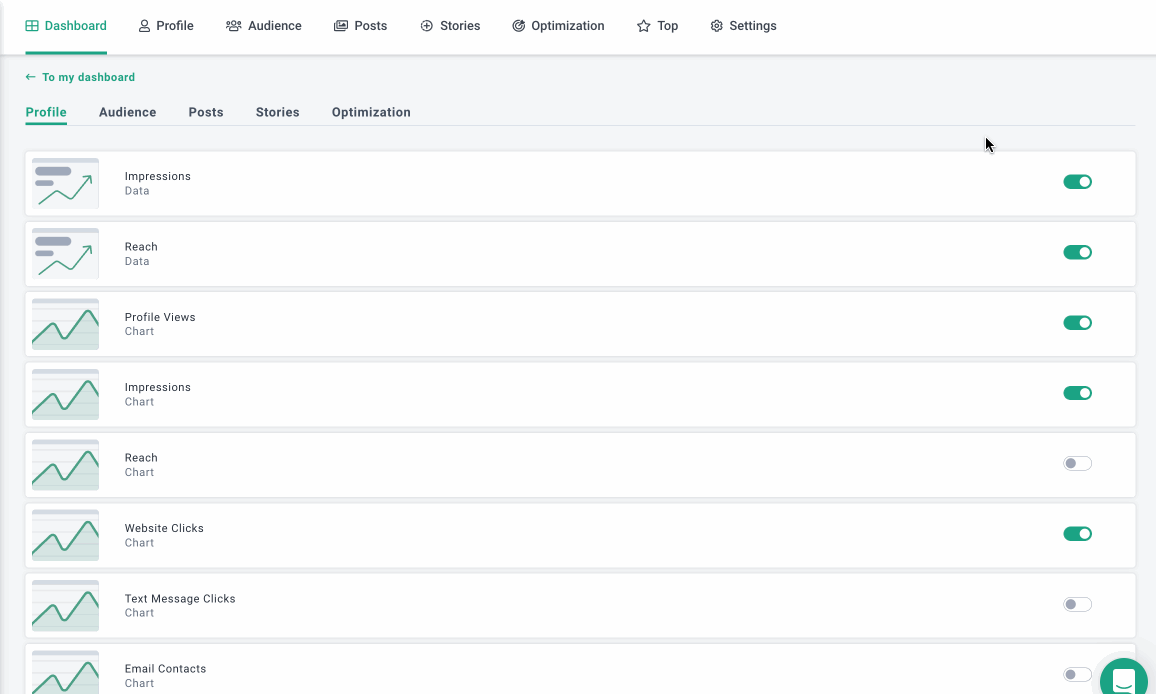
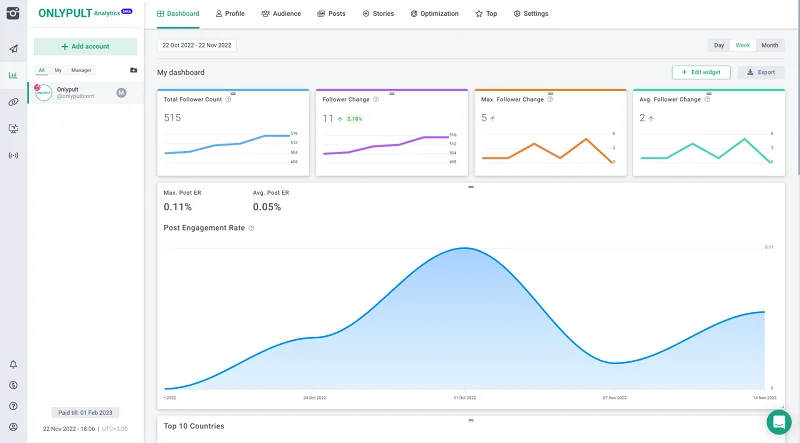
Dashboard. All charts are on the same screen. The Edit widget button sets up a comfortable display for each tab: Profile, Audience, Posts, Stories, and Optimization.
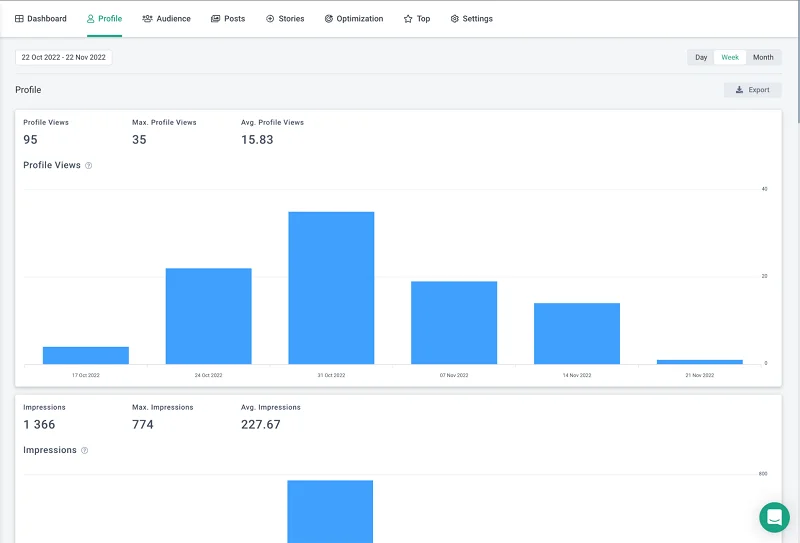
Profile. It shows all statistics on audience interaction with your account: direct messages, site visits, calls, e-mails, profile views, etc.
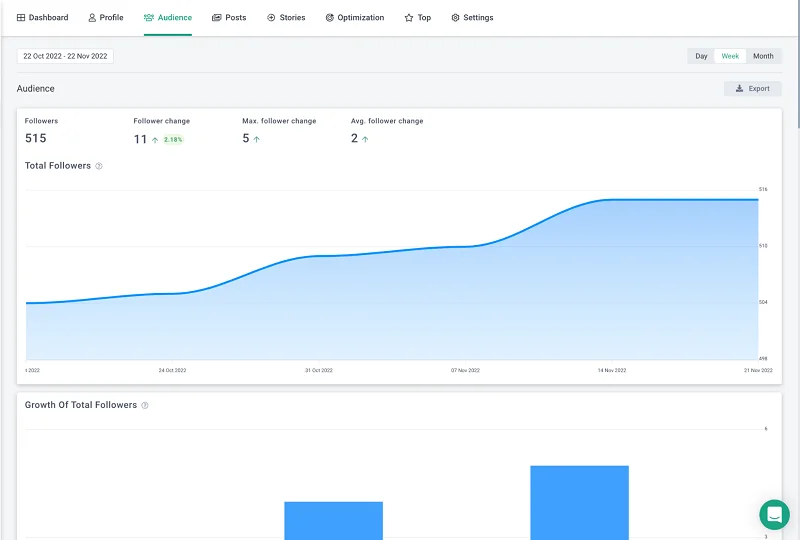
Audience. This section provides the follower count and various audience characteristics over a selected period. You can analyze several charts simultaneously, for example, coverage and the total growth of followers.
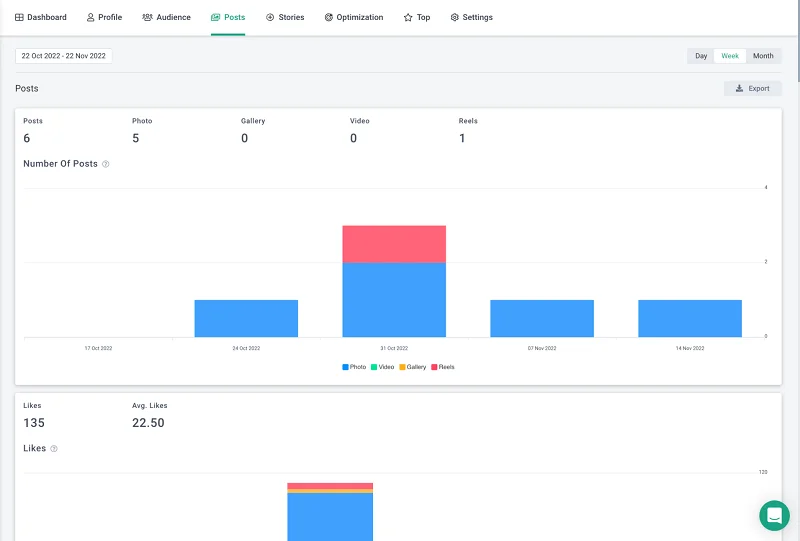
Posts. All statistics on posts: video views, saves, likes, comments, engagement rate, and more.
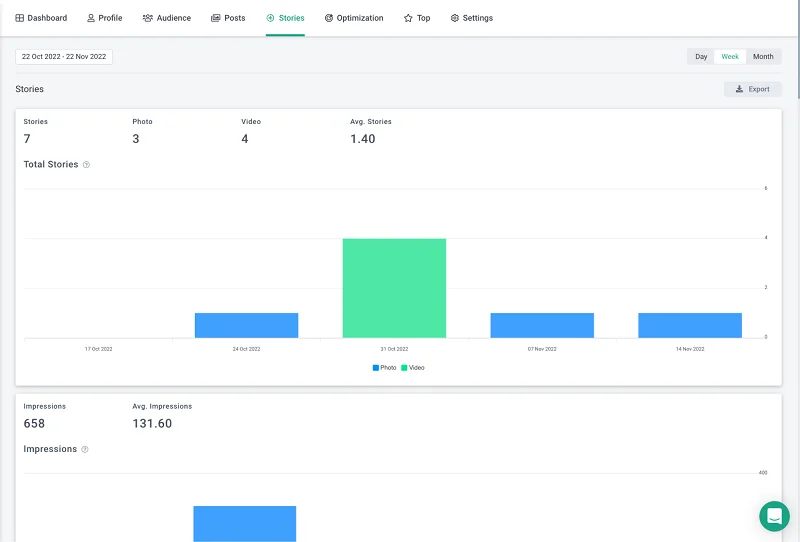
Stories. Full story analytics, including answers, following story clicks, and other statistics.
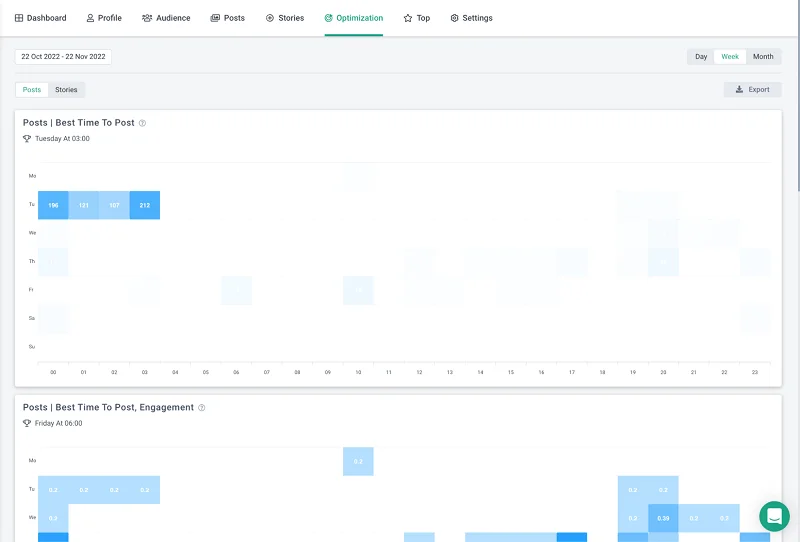
Optimization. In this section, you can see the best time to post, the frequency of publications, density by day and hour, top hashtags, and much more.
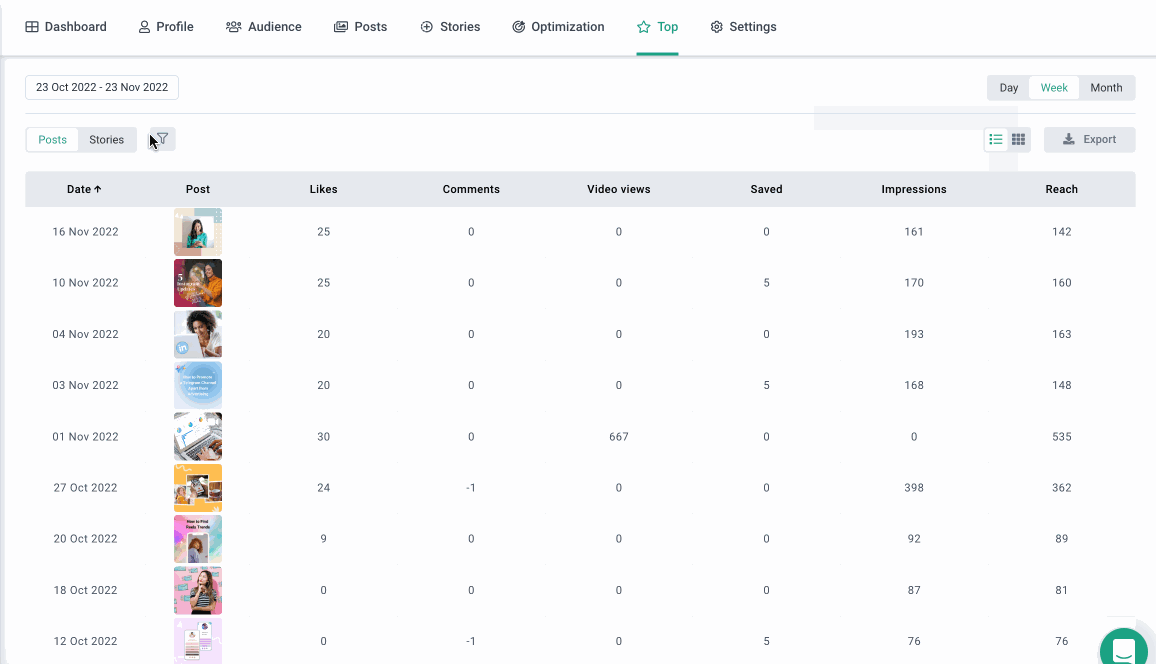
Top. It is a section with content statistics showing you the most successful publications by the number of comments, video views, likes, and saves — in one click only.
In addition, you can view detailed information on a specific publication on posts and stories.
In the coming releases:
- sending reports to your e-mail with the capability to mail scheduled reports for selected social networks automatically;
- incorporated builder to create customized reports for your team or customers by adding your logo to the cover page.
Spoiler alert: we are planning to add new parameters for data analysis in the near future to make your Onlypult experience even more convenient.

With Onlypult, save time you spend on SMM tasks — posting to all social media, analytics, multiple links, micro landing pages, web monitoring. All in one place.