
Is it possible to accurately estimate the profit of a social network account? Or calculate how productive an SMM specialist is? Work efficiency is assessed by a certain list of KPIs, which are regularly updated. This article explains the most useful metrics and how to apply them.
What are social media metrics and why should you track them?
Performance metrics are measured in numbers and tracked over time. Metrics dynamics analysis is needed to achieve the business goals set. Each type of goal has its metrics that can be most effectively tracked.
Different groups of metrics are important for personal, business, and information communities. For example, if you have an information community and you make a profit from advertising, the number of live followers in the group who will click on advertising links is important to you. An online store, on the other hand, needs metrics that directly or indirectly affect how customers move through the sales funnel.
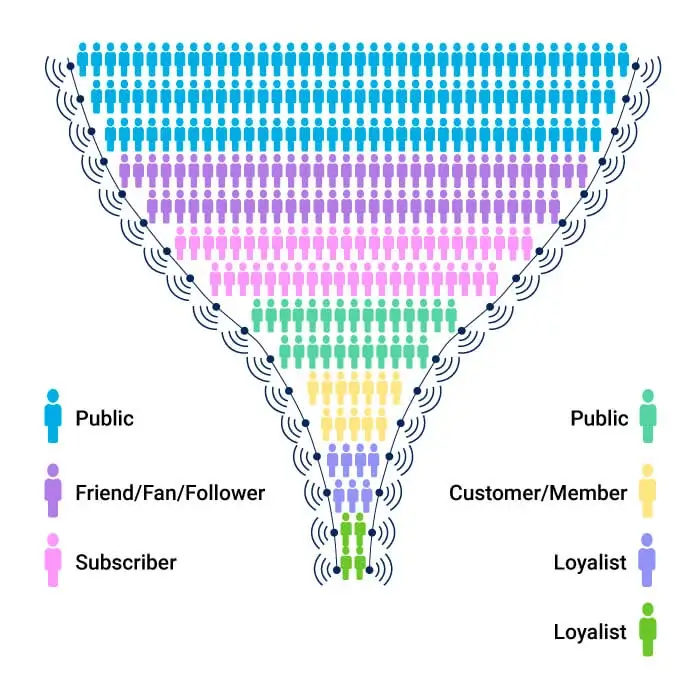
For sales, a tool such as a sales funnel is used. The profit of a business depends on its correct operation. While interacting with a brand, a person can go through several stages:
- People;
- Fans;
- Followers;
- Potential client;
- Client;
- Supporter;
- Defender.
Schematically, the funnel looks as follows:
At each stage of the funnel, hundreds of metrics are applicable to measure performance. In particular, the types of tracked information can be divided into the following main categories:
- Activity;
- Coverage;
- Engagement;
- Attraction;
- Conversion;
- Retention and promotion.
There are other types of metrics, but these are exactly what marketers focus on.

With Onlypult, save time you spend on SMM tasks — posting to all social media, analytics, multiple links, micro landing pages, web monitoring. All in one place.
Activity Metrics
These metrics characterize the activities of the community, the quality, the number of publications, communication with followers, and the response speed. They allow you to estimate the work performed by the team.
Average response time
This is the time between a request from a visitor and a community manager’s response. It applies to private messages, comments, and reviews.
Content assessment
This is the share of each content type to the total number of publications for a certain time. It is necessary to maintain the planned content proportions. For example, 3 videos, 5 selling posts, and 10 images are published per week. In this case, the share of the video will be 3/18 = 17%. When counting, you should consider all the main post types.
Publication evaluation
This term refers to the number of publications during the reporting period. It should be divided into all social networks where the brand is present. The number of posts on Facebook, Twitter, and VK are taken into account. Even forum posts and blog updates are counted.
Hosted topics
Here, we look at the share of posts in one category in one social network to all posts in this social network from the brand for the reporting period. For example, 3 selling posts out of 10 publications per week will give 30% of selling content.
Post type
This is the number of one content type to the total number of content types, including links, pictures, videos, long reads, texts, polls, and so on.
Response speed
It refers to the number of brand inquiries responded by a community manager to the total number of inquiries, including private messages, comments, questions, feedback, etc.
Social media marketing budget
Here, we assess the budget allocated for maintaining a group, creating and promoting the content.
Together with other indicators, activity indicators will allow you to objectively assess the effectiveness of the team’s work on social media promotion.
Reach Metrics
Reach metrics are the metrics used to gauge the quality of an existing audience, as well as potential follower growth and loyalty.
Reach Metrics KPIs:
Audience growth rate
This is the speed of adding or unfollowing group members. It is measured as the number of followers per period divided by the total number of followers. For example, in a week 30 people followed the community, making the number of participants 1000. As a result, the rate is 30/1000 = 3%.
Middle position
It shows which position a group or its posts occupy in key search queries.
Brand recognition
It demonstrates how often a brand is mentioned outside the group.
CPM
CPM regards paid brand promotion and is characterized by the cost of 1000 ad impressions.
Fans/followers
This metric shows the number of followers in different social networks.
Impact assessment
It characterizes the influence of the brand on different social channels. This infrequent and hard-to-read metric was introduced by Klout and Kred.
Keyword frequency
This is the number of the most frequent phrases to the total number of words in the entire blog. The most common phrases and words should be the words related to the activities of the group and the released product.
Posts coverage
This metric is essential for smart feed and display in recommendations. It shows how many people saw the post.
Possible impressions
This is a potentially possible number of post impressions.
Potential coverage
It refers to a potentially possible coverage of the post.
Audience share
This is the share of followers to the total theoretical size of the target audience of a product.
Engagement rate
We use it to compare the indicators with the ones of the competitors’ groups.
Share of the vote
This is the share of the public’s reaction to the brand’s activities compared to the competitors.
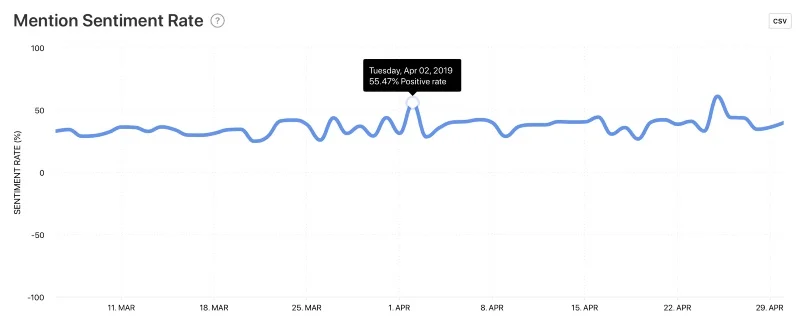
Mood
This is the percentage of the same mood reviews to the overall reviews in the group.
Video views
It refers to the number of views on social media targeting video content.
Reach metrics indirectly measure content quality and audience engagement.
Social Activity Metrics
Such metrics assess the usefulness of the content for followers. It shows how often the posts are returned, shared, or saved to favorites. Social activity metrics include the following indicators:
Comments rating
This is the total number of reposts of one post: “share” button for Facebook, “retweet” for Twitter, and “regram” for Instagram.
Engagement as a percentage of the audience
Here, we look at the number of followers who showed any activity during the reporting period in all social networks to all followers of the community.
Fan / Follower Engagement
Community activity is divided by the total number of followers.
Virality
The speed of content distribution on a social network is measured: for example, all likes / particular content ratio.
These metrics allow you to assess the quality of your content.
Engagement Metrics
Engagement metrics are listed on Google analytics or other analytics services. They measure the quality of the services provided by the brand to attract and retain an audience, its value.
Google Analytics provides the following engagement metrics:
- Leads: the number of contacts received through social networks over a certain time;
- Links: the number of pages with referrals to a particular brand page;
- Email subscriptions: the number of email accounts in the email campaign;
- Micro conversion: indirect metrics that measure any activity before conversion;
- Browse pages: the total number of pages viewed during the reporting period;
- Percentage of social visits: the percentage of conversions from social networks to total conversion;;
- Ranking by keyword: a line in Google search results for a query containing a keyword;
- Sessions: the number of sessions for a period, where a session is an activity of the same type from one device;
- Session duration: the total duration of all sessions in seconds divided by the number of all sessions;
- Traffic: transitions from social networks for the reporting period;
- Traffic ratio: the percentage of traffic from other sites, site address entered, and from search pages.
Engagement metrics allow you to track brand engagement and tackle website issues.
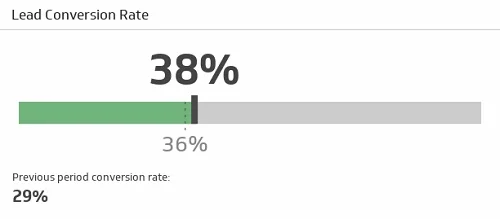
Conversion rate
Conversion is the number of clients from the total number of followers or site visitors. Conversion rate shows how well a website or group meets the needs of the users.
Google Analytics provides most of these metrics:
- Average purchase value / average order value. Average values of the cost of purchases on the site or group;
- The average income per customer. Average values of the customer’s average spending on a given brand. It is considered as dividing income by the number of clients for the reporting period;
- Conversions. The total number of desired actions on the part of the client for a certain time. This can be subscribing to a newsletter, applying for interacting with a specialist, participating in surveys, downloading materials, and so on;
- CPA (cost per acquisition or cost per action). The sum of all funds spent on building reputation and brand promotion usually counted in dollars;
- Cost of conversion. The sum of all budget funds spent on conversion usually counted in dollars;
- New visitors conversion. The number of user interactions with a site or a group among new visitors, over a certain period;
- Returning visitors conversion. The number of user interactions with a group or site by visitors who came to the site again during the reporting period;
- RPC (Revenue per click). The cost of an ad click for the reporting period, calculated as an average value;
- Social media conversion rate. The ratio of social media conversions to the total site or group conversions. It shows the percentage of conversion generated by social networks;
- ROI (Return on investment). Social media income is divided by all social media expenses.
- ROAS (Return on ad spend). The revenue generated directly from advertising is divided by the total advertising spend.
These metrics help you calculate the ROI of your social media engagement, find ways to improve communication, and analyze how close you are to your desired engagement level.
Retention rates
Retention rates are focused on developing followers who have already made a purchase. These indicators show an increase in brand loyalty, overall consumer satisfaction.
Retention rates include:
- Brand evangelists. Customers who can spread brand reviews. These are satisfied customers who will gladly recommend the products to their friends;
- One-time or permanent customer value. Potential income from subsequent relationships with an already loyal customer;
- Customer retention rate. The number of customers who abandoned the brand to their total number;
- Customer reviews/ratings. The number of reviews or assessments of a certain type, for example, negative, for the reporting period;
- Rate of customer turnover/churn. The number of customers who left during the reporting period.
- Customer reviews. Positive feedback for the reporting period;
- K-factor. The growth rate of customer-related metrics, for example, the customer base, the user flow to the group.
- Net seller rating. The average of the responses to the question “Would you recommend the product to your friends?” with responses ranging from 0 to 10 probability points.
With a quality product, the chance of re-selling the product outweighs the chance of acquiring a new customer. Therefore, it is important to monitor the metrics that demonstrate customer brand loyalty after purchase.

Onlypult posts to all social media platforms, provides analytics data, builds teamwork and saves you time.
Social Media Highlights for Every Marketer in Year 2024
The article contains many indicators that will be useful to take into account when doing business. The choice of KPIs to use in your project is a personal choice of a business owner or promotion team. We have selected the most popular and illustrative ones.
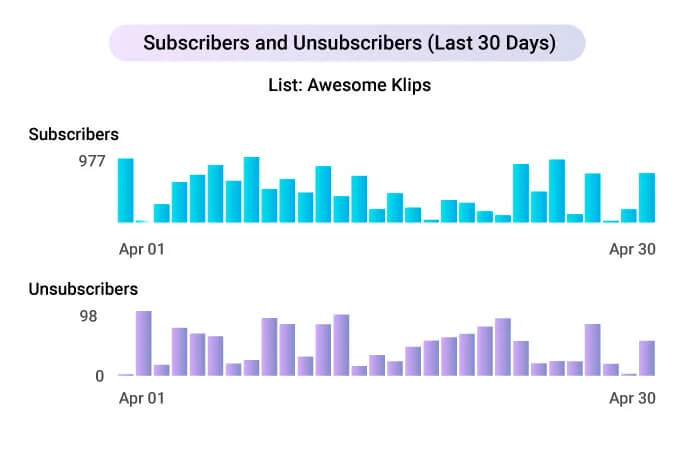
Followed and Unfollowed
Type: Reach Metrics.
What it measures: The number of followers in the group, the number of ‘followed’ and ‘unfollowed’ for the period.
Why it is important: It allows you to evaluate the activity of an SMM specialist, track the use of follower promotion and improve all other indicators.
How to track: For your page, this information is available in the analytics of the group or third-party analytics services.
Audience growth rate
Type: Awareness Metrics.
What it measures: It shows how many page visitors turned into community followers.
Why it matters: It assesses the public’s interest in the group’s material and indirectly indicates the quality of advertising.
How to track: Number of new followers / (number of new followers - number of ‘unfollowed’) * 100%.
Impressions
Type: Reach Metrics.
What it measures: It shows how many times a post has appeared in the news feed for all followers, in recommendations, and so on. This is the total number of impressions for the entry, without division into primary and repeated impressions.
Why it matters: It shows the public’s interest in the post
How to track: The information is available when you view account analytics.
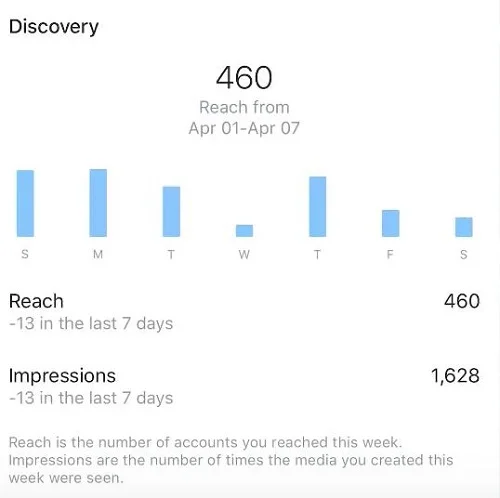
Post Reach
Type: Awareness Metrics.
What it measures: The number of unique post views.
Why it is important: It allows you to evaluate the interest of the post for the algorithms of the social network. The algorithms determine how many followers will see this post in the news feed.
How to track: The information is available in group analytics and services.

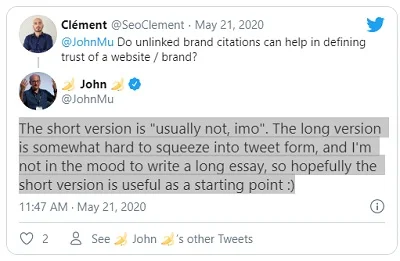
Brand awareness
Type: Awareness metrics.
What it measures: Attention to the brand on social media; the number of mentions, reposts, likes, recommendations, and followers’ activity.
Why it matters: It shows how well the brand is heard and stands out compared to the competitors.
How to track: It can be tracked manually or using monitoring tools. The team selects the recognition criteria and monitors them on social media.
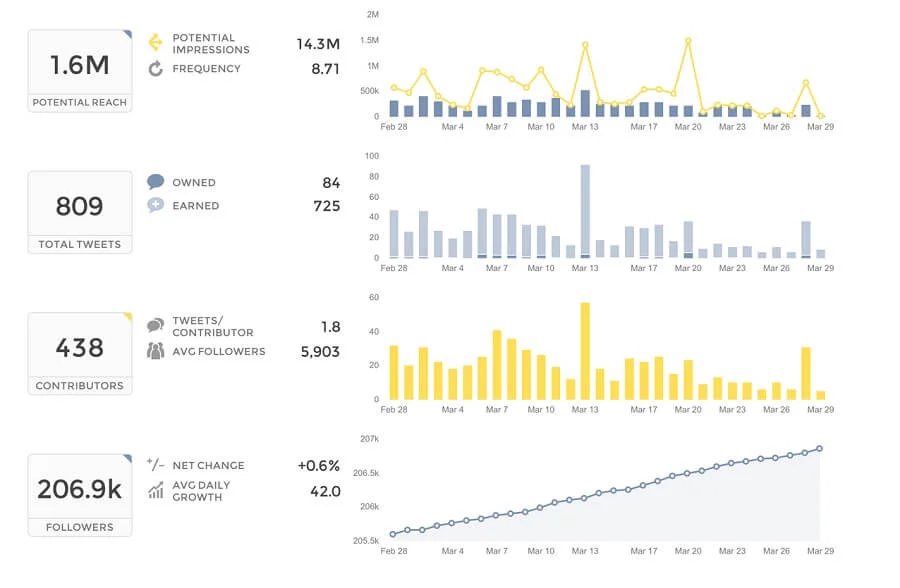
Potential reach
Type: Awareness Metrics.
What it measures: The potential number of users who can see a particular post. This is the number of friends of followers who will see the post in case of a repost.
Why it is important: It provides expansion opportunities, attracting new followers.
How to track: About 2-6% of followers will do a repost, and the repost will be seen by their friends.
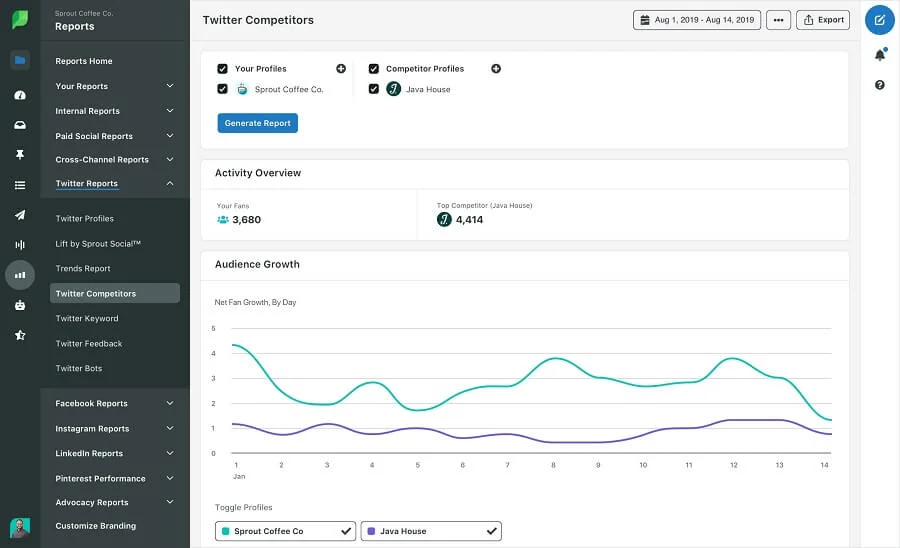
Share of Vote (SSoV)
Type: Awareness Metrics.
Measures: How many people mention the brand on social media compared to the competitors.
Why it matters: This shows the importance of a brand to the importance of a competitive product.
How to track: The number of your product mentions / (the number of your product mentions + the number a competitor’s product mentions) * 100%.
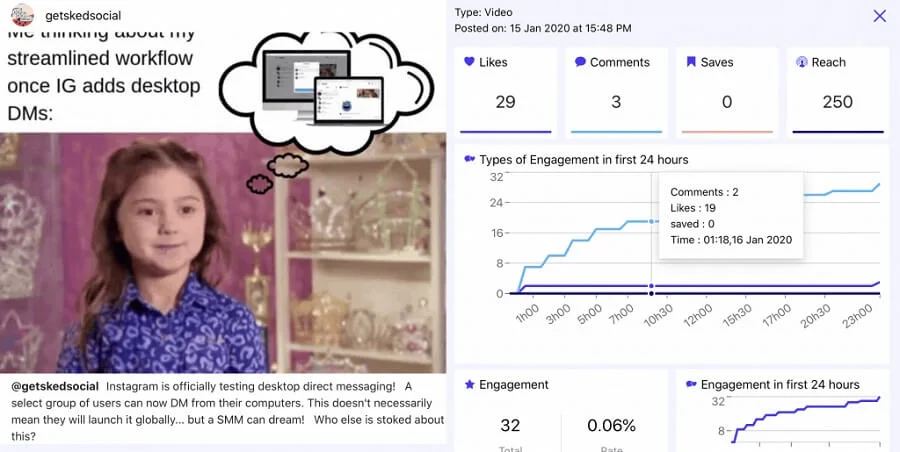
Average Engagement
Type: Engagement Metrics.
What it measures: The number of positive user interactions with the post, for example, likes, to the total number of followers.
Why it matters: It is important when building a content plan and taking into account the analysis of followers’ activity, that is, excluding the categories with the least response from the content and including more useful target audience content.
How to track: (Number of selected activity) / (number of followers) * 100%.
Propagation rate
Type: Engagement Metrics.
What it measures: The number of reposts to the total number of followers.
Why it matters: This shows what percentage of the audience is loyal to the brand and gives preference to it.
How to track: (All reposts for the period) / (number of followers) * 100%.
Viral rate
Type: Engagement Metrics.
What it measures: The ratio of the number of shares to the number of unique impressions.
Why it matters: It shows the quality of content, audience engagement. The higher the metric, the better the content in the post.
How to track: (Shares) / (impressions) * 100%.
Conversion rate
Type: Conversion Metrics.
What it measures: The number of people who performed a useful action after visiting the page.
Why it matters: It shows the value of the content to the users.
How to track: The most convenient way to count is the number of clicks on the tracked link.
Formula: (conversion) / (total clicks) * 100%.
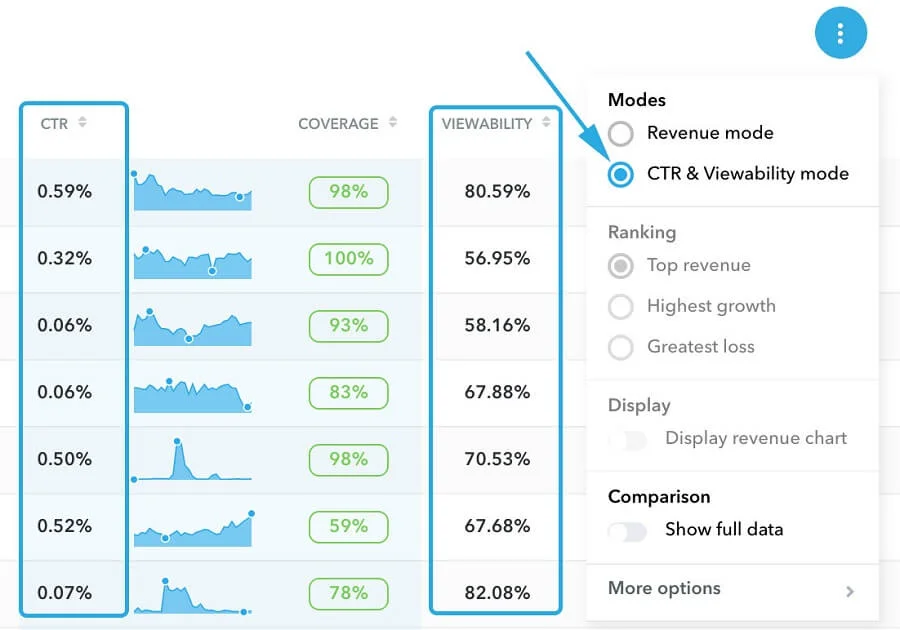
Click-through rate (CTR)
Type: Conversion Metrics.
What it measures: The number of clicks on a link in a group message over a certain period.
Why it matters: It allows you to estimate the value of the offer that is advertised in the post with a link for the target audience.
How to track: (clicks) / (impressions) * 100%.
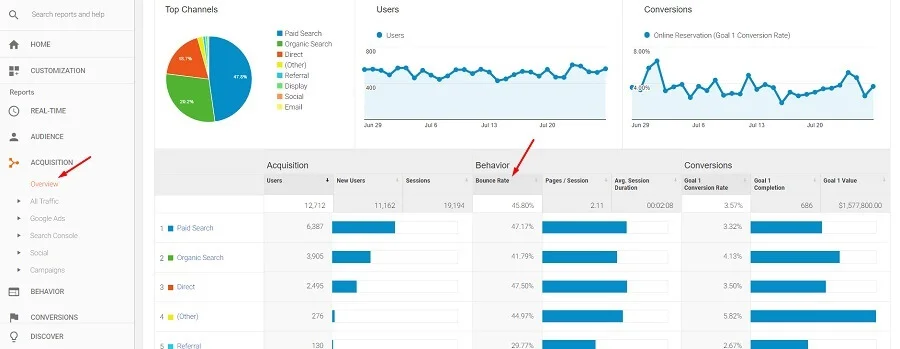
Bounce Rate
Type: Conversion Metrics.
What it measures: The number of users who perform only one activity on the page; they just click on the link, and they are not interested in the page itself.
Why it matters: This shows how many visitors are useful to the group and how many are not. This is an indirect indicator of the quality of the material on the page and the correctness of advertising settings, determining the target audience.
How to track: Via Google Analytics.
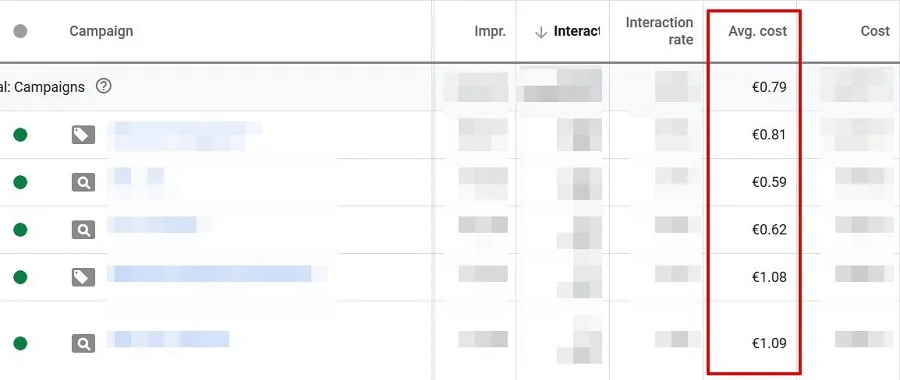
Cost per click (CPC)
Type: Conversion Metrics.
What it measures: The cost per click for an ad message.
Why it matters: It tracks the effectiveness of community ads.
How to track: Track this metric in the ad account, set a limit on the amount of write-off per day.
Formula: (ad spend) / (click cost).
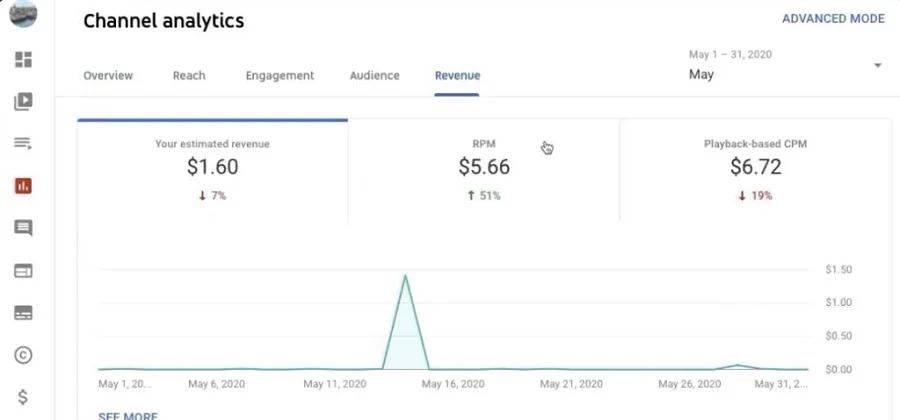
Cost Per 1000 Views (CPM)
Type: Conversion Metrics.
What it measures: The amount per 1000 impressions of an ad post.
Why it matters: It is less costly than click-through advertising. It does not force the user to follow the link but tries to provoke interest in the content.
How to track: Regularly check statistics in the advertising office; set restrictions on impressions.
Formula: (all ad spent) / (all impressions) * 1000.
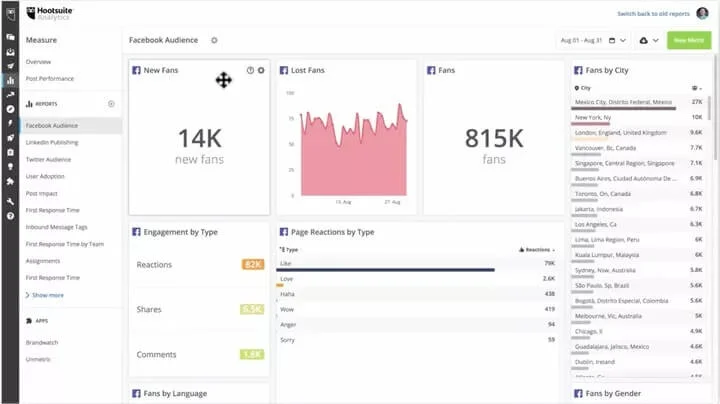
Dialogue Speeds
Type: Conversion Metrics.
What it measures: The number of active followers in a community.
Why it matters: It measures the degree of involvement in the information given in the post.
How to track: Using analytics tools such as Hootsuite Analytics, you can get the number of comments per period and the number of new fans.
Formula: (number of comments for the period) / (number of followers) * 100%.
Customer Reviews
Type: Customer Metrics.
What it measures: Any evaluative brand mentions by the users.
Why it matters: Positive reviews are a sign of a satisfied customer. They lure new customers and create a positive brand image on social media.
How to track: Track them manually or using analytics tools for brand mentions. Ask your clients to leave feedback on a purchased product or service.
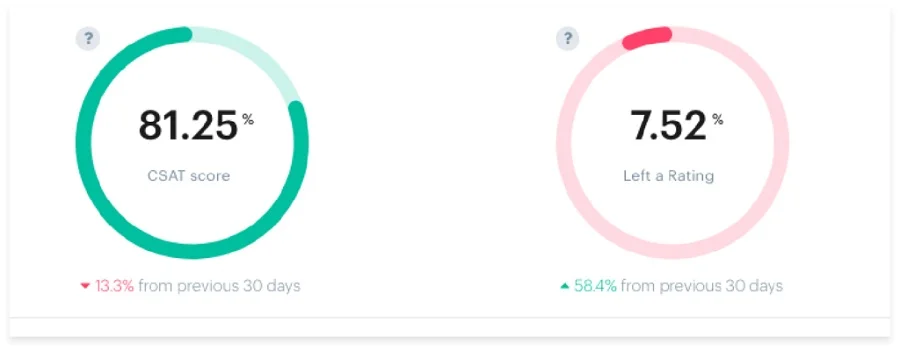
Customer Satisfaction Score (CSat)
Type: Customer Metrics.
What it measures: Customer evaluations of the products.
Why it matters: It provides a measure of consumer satisfaction.
How to track: Following an item purchase, ask the clients how satisfied they are. It is important to provide assessment criteria and a rating scale.
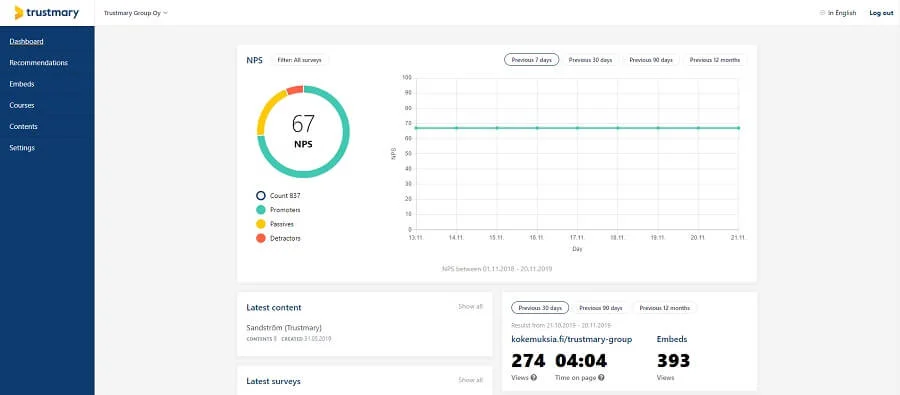
Advance Rate (NPS)
Type: Customer Metrics.
What it measures: Whether the customers will advertise the product to their friends, whether they are happy with the purchase.
Why it matters: It allows you to measure customer satisfaction with the purchase and predict future sales.
How to track: Ask if the product will be recommended to your friends.
In this article, we provide the most important metrics to analyze the effectiveness of a brand’s social media campaign. The challenge for every business is to use them wisely and select the ones that will help achieve business goals.
A simple post scheduler for all platforms, a user-friendly media editor, and posting at the time you need — Onlypult provides this all.