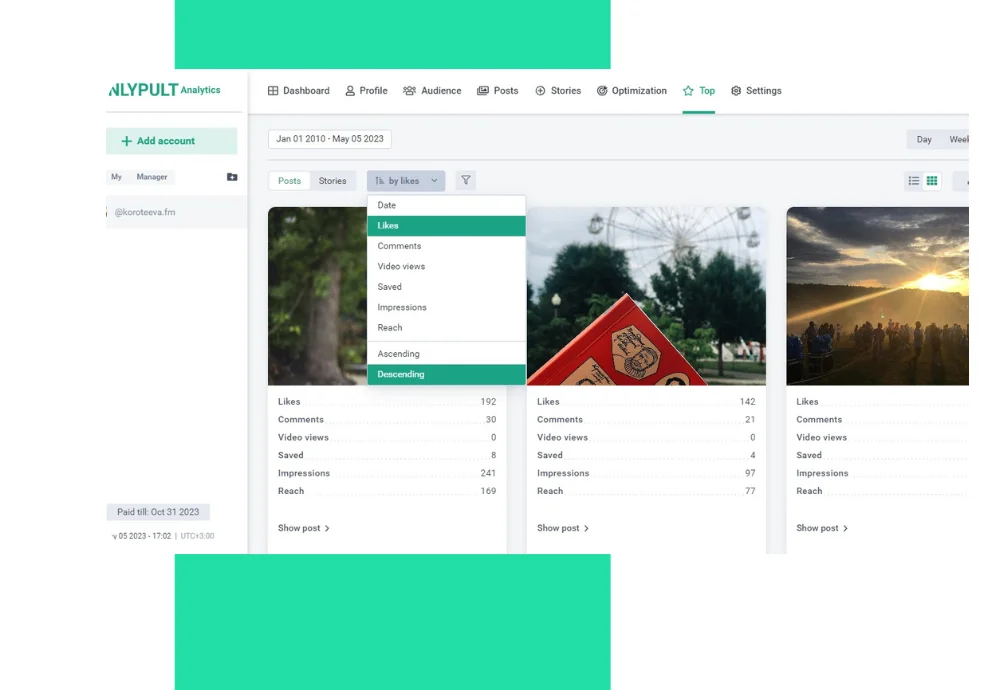
Built-in statistics are available to all users of Instagram business accounts. The data appears after activating this type of account in the Settings section.
To work with this data, you need to track information for each post and story and manually analyze them. For example, to find out which posts are consistently gaining more reactions.
It is necessary to draw up an account development strategy and adjust it while working on the content plan.
How to work with the Best tab
The Best tab shows the most popular posts. You can view them as a list or as a tile and choose the view option next to the Export button.
The statistics include the following data: the number of likes, comments, video views, saves, publication coverage, and engagement rate.
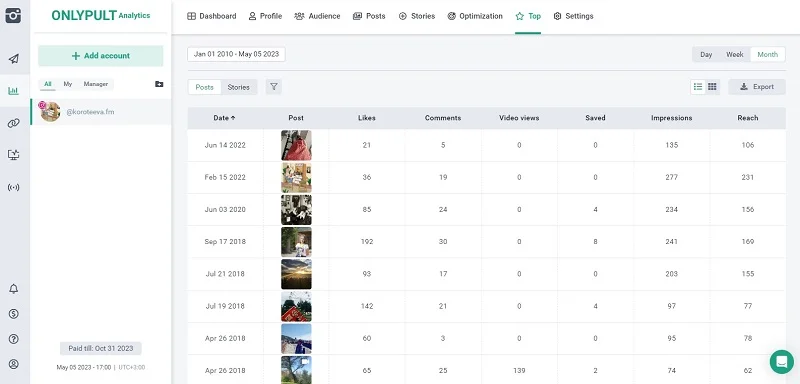
To view data for a specific content type, for example, only videos or collections of cards, check this box in the tab.

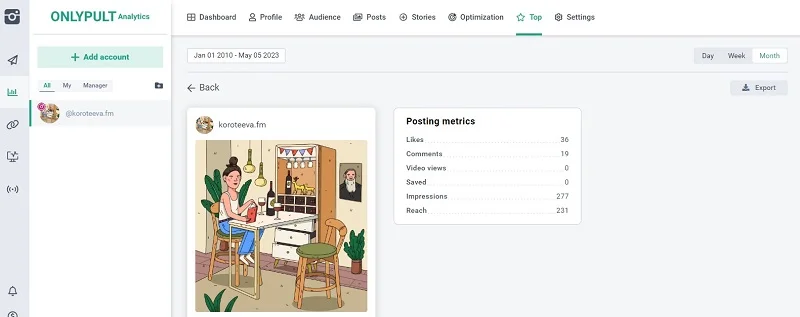
Clicking on a post will allow you to view it itself and its detailed statistics.
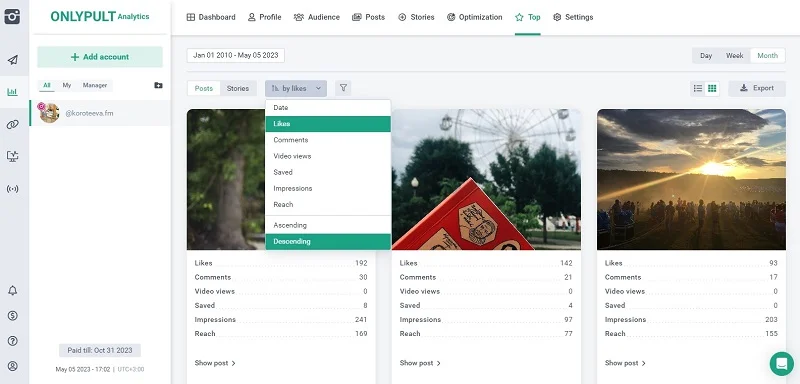
You can sort the content by different parameters and for different periods. Set the required dates and filters — the number of likes, comments, etc.
Why analyze the most popular posts on Instagram
Analyzing what type of content and specific topics received the most reactions is vital at any stage of working with an account.
At first, it will become clear how to adjust the current strategy: what to add to the content plan and which topics you do not need.
For example, content managers can rely on videos of cosmetologists analyzing the composition when launching a new cosmetics brand. But the content analysis can show that memes or photos taken by customers receive more reactions.
Then you can change your approach to the expert content — for example, test live streams, where followers will ask questions in person.
