
Instagram continues to grow as one of the most popular social networks for all ages, countries, and brands. Its audience of active users exceeds 2 billion people per month, the engagement rate for each post reaches 1.16% (Facebook has only 0.27%), and 70% of users are ready to make purchases through Instagram.
This popularity of Instagram is successfully used by businesses — for example, in the US, 71% of companies use Instagram to promote their business, and 96% of marketers work with Instagram as the core promotion platform daily. Other countries show similar statistics.
But it is not enough to upload photos, write posts, and respond to comments to run a business page on Instagram efficiently. To be successful, it is necessary and vital to understand what audience is following your page, what they like, which topics resonate with them, and which content delivery provides the desired conversion. Collecting this data can be done manually or with the help of the standard Instagram tools, but it has limited options — so it is easy to miss important patterns and insights.
For more accurate and comprehensive monitoring of your Instagram page, we recommend using the Analytics service in Onlypult. We will tell you what it is and how you can benefit from it.
About Onlypult
Onlypult is a multifunctional platform that allows you to manage all your social media channels in one place. The service simplifies work with social media for freelancers and bloggers, brands and agencies, and small and large businesses.
Onlypult provides users with cloud-based tools for publishing, analytics, monitoring, and streaming on social media, as well as tools for creating mobile websites, landing pages, and multilinks.
With Onlypult, you can:
- upload photos and videos via the web, schedule posts for the future, or publish them in real time;
- manage multiple accounts from one window at the same time;
- connect employees to running an account, give SMM managers access to publications without providing an account password;
- track what your competitors are doing.
Along with this, Onlypult has also implemented the Analytics service, a tool that allows you to monitor the reach and growth of your followers, always know the best time to publish posts, determine the most popular hashtags, generate reports on the work done, and receive other important information. Find more about this tool below.
Features and functionality of Onlypult Analytics
The Analytics service is available to all Onlypult users immediately after registration — you do not need to pay separately and additionally integrate it into the Onlypult personal account.
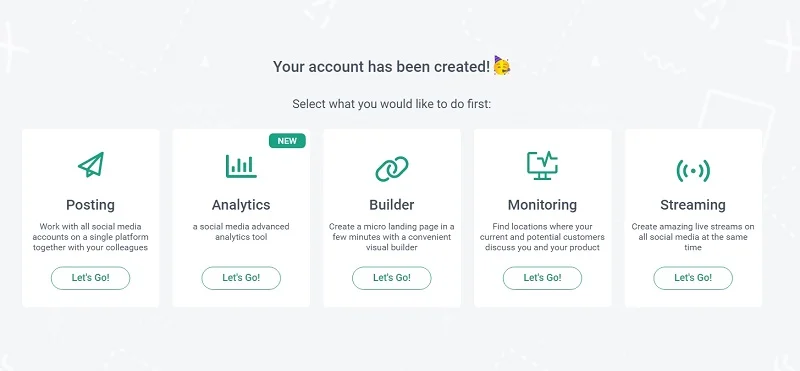
Getting started with Onlypult Analytics is easy — select the required tool and add the desired business account or Instagram creator account (note that you cannot link Analytics to personal pages).
Immediately after that, you can start full-fledged analytics of the linked channel using all the available sections. Here is what they are.
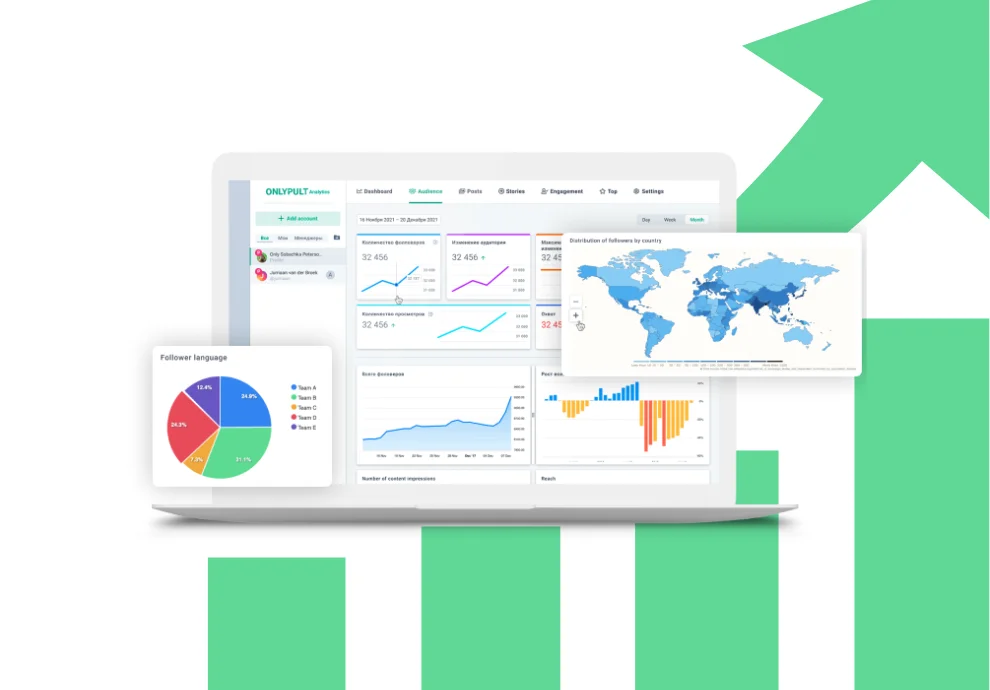
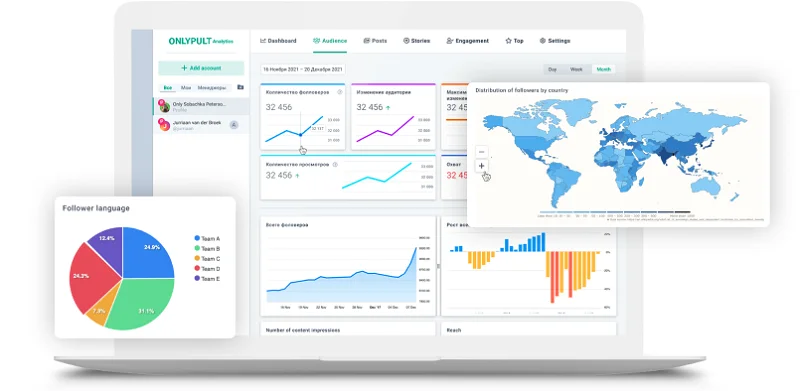
Dashboard
The interface has a separate section for dashboards. It contains graphs with all monitored metrics, which you can add or remove.
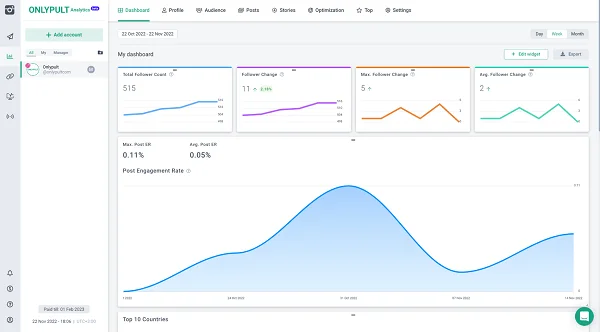
For example, you run a business page and want to see how the number of followers, likes, shares, and comments changes. With standard Instagram tools, you can only view each of these graphs separately, which is not always informative. In Analytics, you can get all aggregated, displayed on one screen, and freely placed in a convenient order. As a result, you can immediately see, for example, how the growth of followers affects the number of likes and reposts.
In addition, in the Dashboard section, you can configure how the information will be displayed in each subsequent tab.
Profile
Analytics has a separate section with all the statistics of how followers interact with the tracked business account.
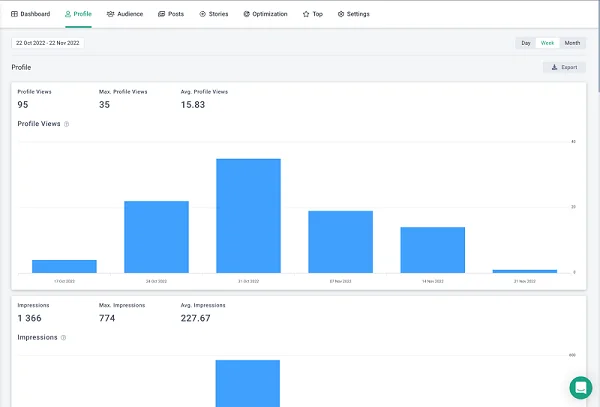
You can easily see in the section how many messages Direct contains, how often your followers call the indicated phone number and write e-mails to the linked mail address, how many views the page has, and much more. The advantage of this format is objectivity — an SMM specialist or marketer can evaluate the effectiveness of targeted advertising, look at the dates to see when interaction activity is growing or falling, and then compare this information with publications on the page. It is especially vital when planning a promotion strategy or marketing campaigns — you can forget about complex testing of various scenarios because analyzing statistics will help you understand which content format is more suitable.
Audience
The Audience section is the best place to explore your own followers. Everything is in one place: gender, age, location, and other parameters. This information is priceless for any SMM specialist and marketer as it allows evaluation of those who make up the ‘core’ of the target audience.
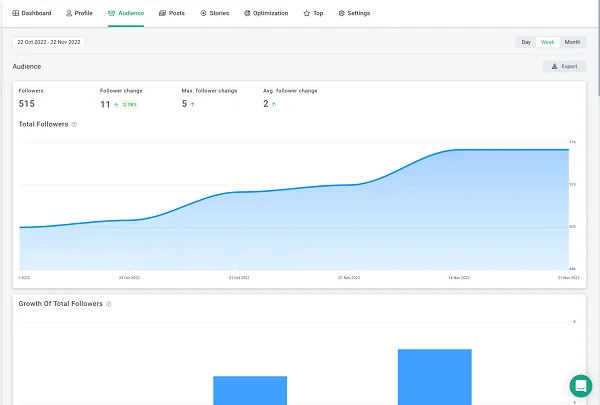
You can study the audience of your own channel in detail and plan, thematic activities or sales based on this information — for example, for March 8, Mother’s Day, Father’s Day, or other ‘niche’ holidays.
Posts
It is a section in which you can see all the information about publications in your account: how many times the post has been viewed, how many likes and comments it gets, how often it gets saved, what engagement rate it has, and other data.
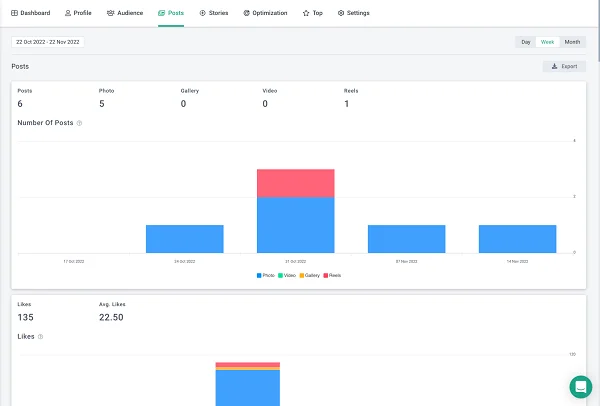
In Onlypult Analytics, information partially duplicates data from Instagram statistics but in a more convenient, visual, and expanded format that makes it easier to understand which post got more likes from followers. For example, this will be useful when testing the design or content concept when you need to find out what is catchier to users.
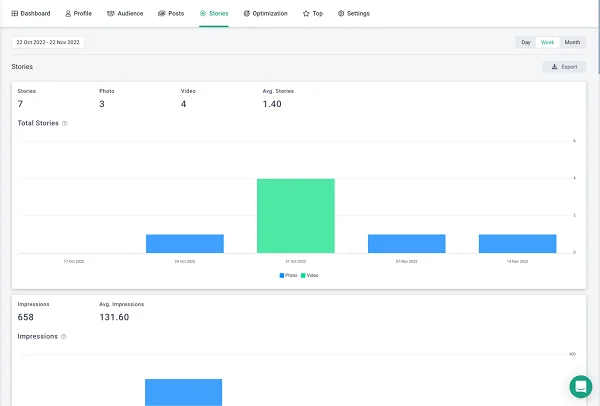
There is a similar section for Stories — all detailed statistics on views, responses, clicks, and other actions with Stories are available there.
Optimization
One of the key features and values of Onlypult Analytics is the Optimization section. It is a knowledge base for an SMM specialist that natively solves most of the current tasks of page promotion and allows you to find out when and what time it is better to publish a post, what tags to use, and so on.
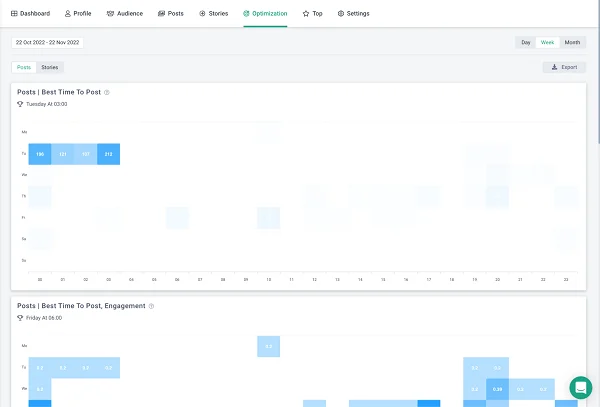
You cannot overestimate the value of these data. For example, before publishing, an SMM specialist usually needs to analyze when user activity is higher, what tags help the post to get to the recommendation page, how often you should launch a campaign and other metrics. It is difficult, often time-consuming, and, due to the human factor, does not guarantee objectivity. The Optimization section helps to give up your routine — to find out everything you need, go to the relevant tab, where you can monitor all charts simultaneously.
Top
It is a section that presents posts and active stories that have received the most likes, saves, views, comments, and other activities of followers. This section allows you to see what content followers liked the most immediately.
Based on the information from the Top section, marketers and SMM specialists can adjust the channel promotion strategy and generate visual reports with numbers and graphs for customers, which is more convenient and understandable than standard Instagram statistics.
Why Onlypult Analytics is better than standard Instagram metrics and tools
Instagram has implemented many tools for business accounts to track page performance. But even they do not allow you to see all the details and monitor followers’ behavior patterns. Onlypult Analytics solves such problems. Our service has other benefits as well.
- Graphs are customizable. You can select the parameters for collection and arrange them in the desired order — you do not have to collect metrics you are not interested in. The dashboard will be the way you need it — it’s more convenient and informative than working with standard Instagram statistics.
- No need to pay. Analytics is a part of Onlypult. If you already use Onlypult for posting or account management, you don’t need to pay extra — the service is available as part of the package.
- You can share access. In Analytics, the collaboration feature is available via the Team section, where you can share access with clients or colleagues, for example, so that they can personally check the statistics. At the same time, you do not need to share passwords and other personal data — access can be given in a couple of clicks without risking the security of your account.
- You can create and download reports. Onlypult analytics simplifies your workflow. Do you need a report for a client, colleagues, or even a portfolio? It can be generated in Onlypult and downloaded in XLS or PDF. It is fast and easy.
- Statistics are available for a long time. The built-in Instagram tools allow you to track metrics for a short period or for each post separately, which is inconvenient. Onlypult analytics lets you track statistics over a long period — data from your Instagram account is available for the last 10 thousand posts is comparable to several years.
In the near future, the following additional features will be implemented and added:
- sending reports to e-mails with the possibility of automatic sending according to a schedule for selected Instagram accounts;
- built-in designer to create customized branded reports (with brand logo on the title page) for your team or clients;
- new options for data analysis.
Summary
Instagram is a popular social network with a large audience, which many businesses use successfully. But the built-in business page analytics tools are often not enough - they do not allow you to objectively evaluate all the metrics and track all the activity of channel followers with both new and old content. Onlypult Analytics solves these problems - with its help, an SMM specialist, a marketer, and even a customer can easily analyze how best to develop an account, what audience to target, and what methods to use for it.

With Onlypult, save time you spend on SMM tasks — posting to all social media, analytics, multiple links, micro landing pages, web monitoring. All in one place.