
How to turn on the statistics?
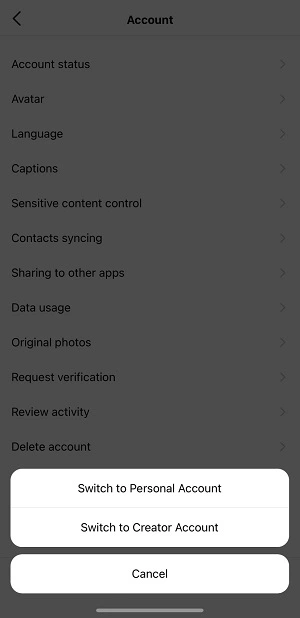
Instagram Statistics is available to all the users having either a business account or an account of an author. You need to link your personal Instagram account to Facebook. Right after that, you’ll get access to the statistics.
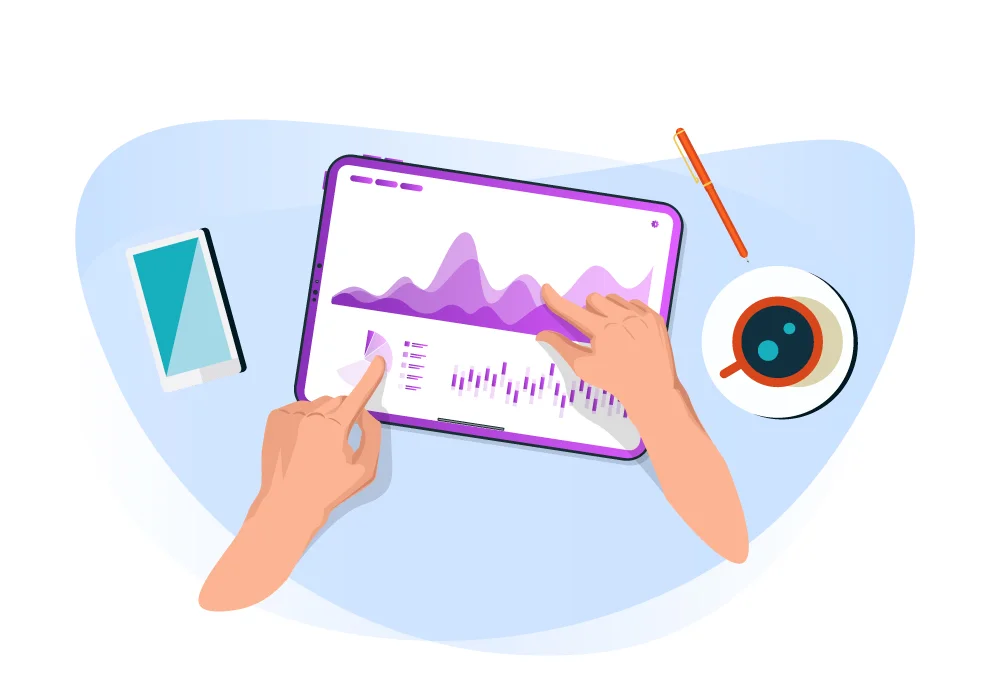
Statistics on your PC
Now you can view the statistics of your posts on your PC. Once you log in to your account via the desktop version of Instagram, you get to see the statistics of any of your posts. Easy like that!
Engagement
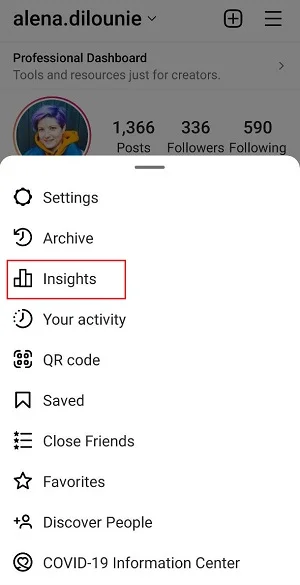
How to get statistics? Go to the main menu and choose the Statistics tab.
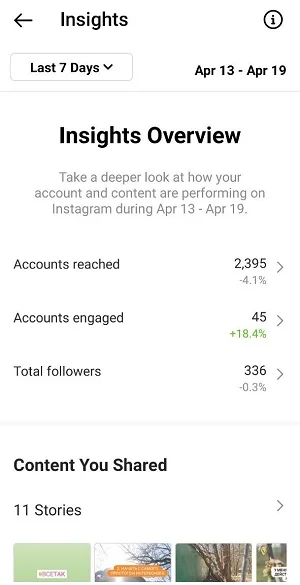
Here it is necessary to set a period (this function was not available before), for example, a 30-day period or a longer one. Statistics show decent results when you analyze it over a long-term period, as you get fewer outbreaks or less randomness.

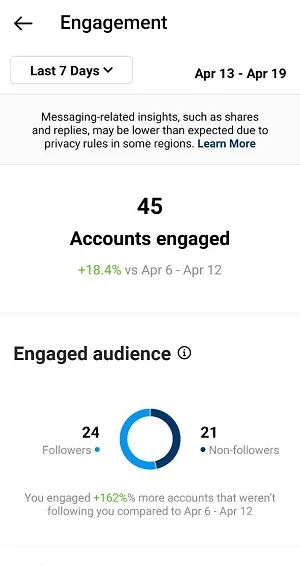
Engagement. You can see your audience with details on cities, countries, age, and sex. This data on cities and countries shows you the users who accessed and viewed your content other than your followers.
You can also analyze by content: views and reach, info on who views your content — either your followers or newcomers. It matters a lot as it gives you an idea of your audience. For example, your posts reach some number of users, but who are these users? Are they the ones who came to you by hashtag? Or are they the ones who saw you being tagged or recommended? Or are they your followers, i.e., your regular audience?
Statistics by content are also available by popular posts, stories, videos, lives, and impressions (the number of times Instagram shows your content as recommended, on the feed, hashtags, or somewhere else).
Statistics of likes and comments
Engagement. You can see where your audience is from and learn the age of the users most involved with your content. It means you get to see the people who like your content. You can see a more detailed report on engagement with decomposition to likes, comments, saves, and reposts.
Follower growth
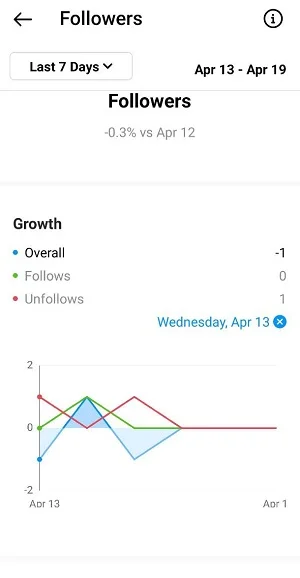
Here you can view the dynamics for a specific day or get a general picture of new subscribers’ number dynamics and those who decided to unsubscribe.
The main feature of this section is to see your subscription diagram to control the balance and make sure you get more new followers rather than those who decided to unsubscribe.
Posts and stories analysis
The main page shows you a breakdown of your content. The Posts section shows you everything about your postings by any metrics: comments, followers, hits. Here you also see engagement and the most commented post.
Onlypult posts to all social media platforms, collects analytics data, allows creating micro landing pages and multiple links, and helps monitor what people say about your company.
You can get the same information on your stories — just choose the metrics for any period, and you will see which Story got most of the views and which got the fewest. There is another vital metric for videos — it is the average percentage watched. You do need to take it into account and analyze the videos with a longer watch time and, thus, get an idea of what works well and makes your followers stay. Try to make such videos further on.
Bottomline
The main idea of the statistics is that users should apply them. You need to track what kind of content gives higher engagement, what part of the audience it affects, and what type of content brings higher engagement and why. For example, your video shows high audience retention — watch it again and try to understand the reason. Or you might take your stories over the last month and retrospectively check which of them got the highest number of views, and then you ask yourself: ‘Why does that happen? What are the common features of these stories?’ Such insights will give you an understanding of what good content is and which audience like it, how to make this kind of content, and what things appeal to users. When you know all this — you can scale, improve, and forecast your content.