
Statistics analysis on a daily, weekly, and monthly basis allows you to upgrade your content, evaluate the advertising effect, and attract more customers and followers.
Instagram gives some standard set of tools for analytics, but it is quite tricky. Try using Onlypult Dashboard and feel the difference!
Onlypult users can add an Analytics tool to their accounts. NB: you have to have a business account on Instagram to do the analytics.
Dashboard diagrams
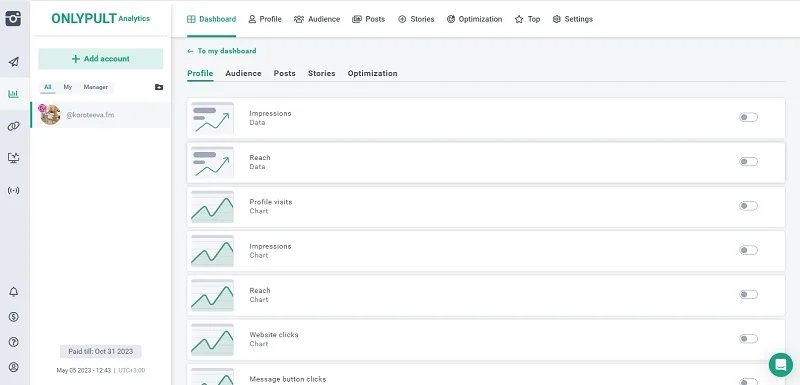
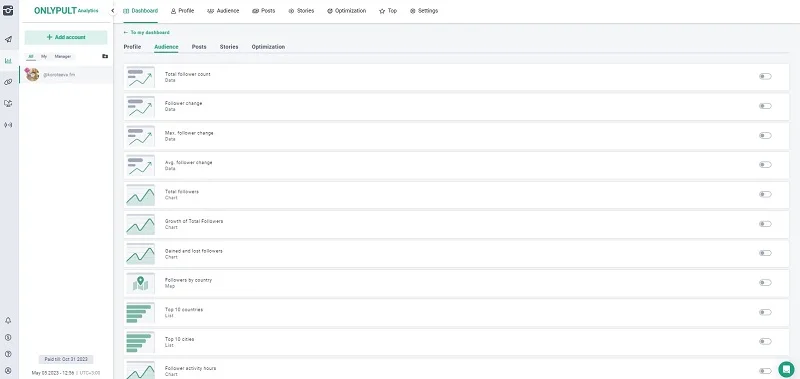
When you click Add widget, the menu with the following options will appear: Profile, Audience, Optimization, Posts, and Stories. We will inspect the first three — to learn more about content, click here.
The Profile section shows general data. You can see the number of unique views, impressions (i.e., the number of times when your content was shown to users), and reach (i.e., the number of unique users who viewed your content over a set period).
Besides, if your account contains a URL to your website, you can set an option to send e-mails, make calls or check the address. All that data will be displayed in the Profile section.
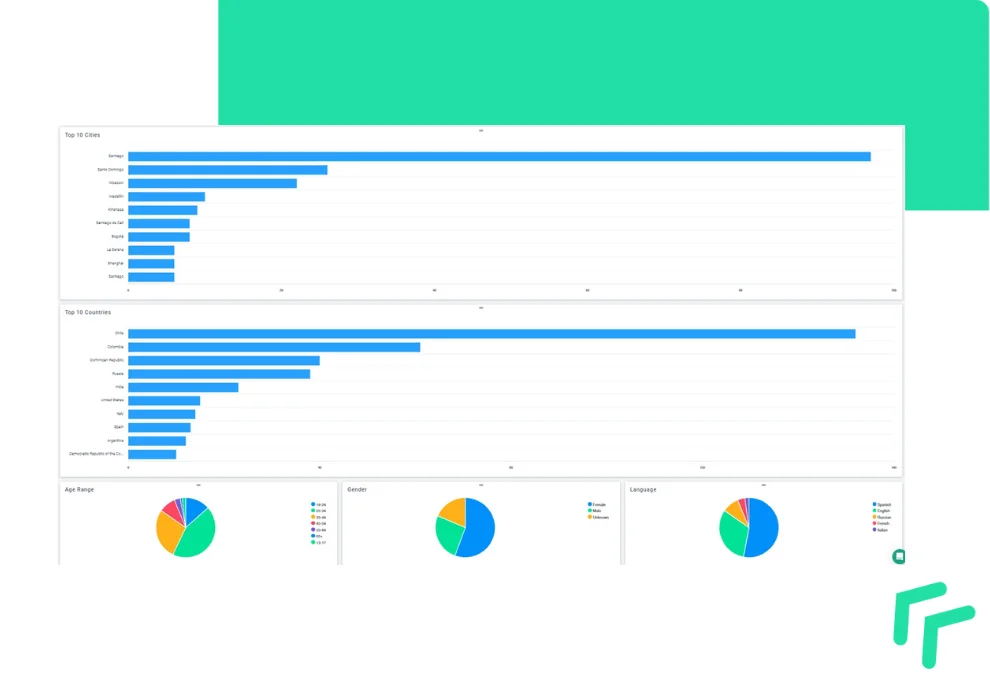
The Audience section provides daily statistics on the number of your followers and shows the details of gained and lost followers, top 10 locations, audience age, and activity.
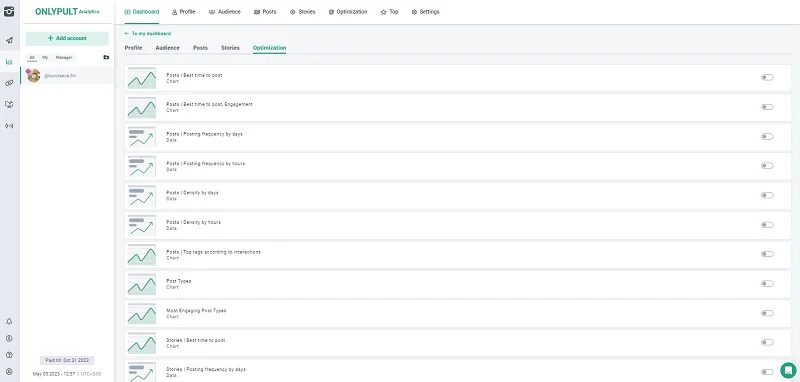
The Optimization section shows data on the best time for posting, depending on various parameters — engagement, frequency by days or by hours, and by types of posts (photo, video, gallery, or reels).
Dashboard and tasks
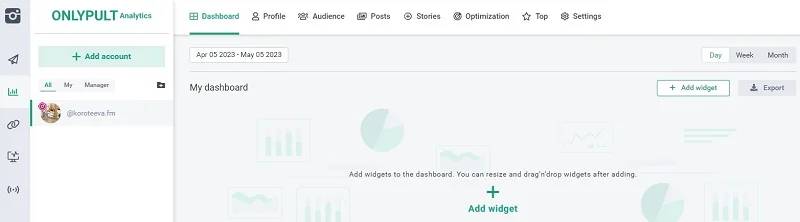
You can add widgets to the Dashboard. Once you have added them, you can change their size and lineup so that your display page is handy for following the main metrics on each project.
For instance, your social media manager reports daily on engagement and website clicks, as most CTA stories are linked to your account bio.
Every 2 or 3 days, you may launch selling posts on your Instagram account. Thus, it is VITAL to know the highest audience activity hours — the days and time intervals when users are the most involved.
Your company is a local business, so it is also vital to understand whether you are good at targeting and bringing enough traffic to your account.
With all that, your Dashboard can look like that:
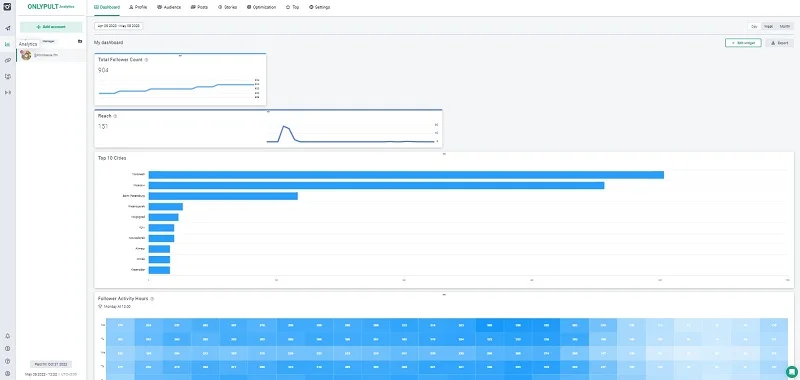
To personalize settings, you can click and drag any widget on the Dashboard.
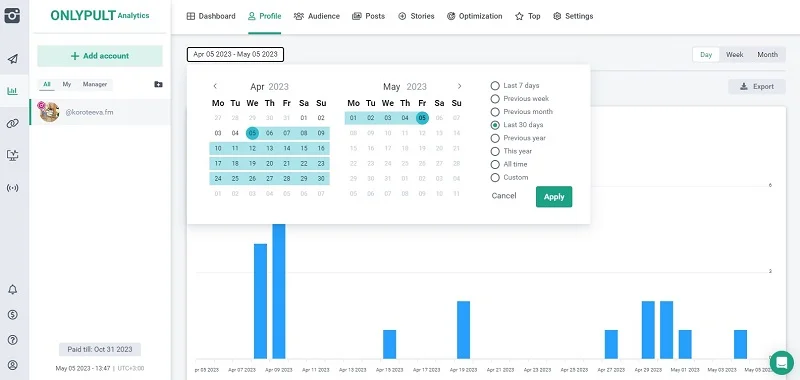
How to adjust ranges
Statistics are shown for various periods of the account’s operating time. You can set the following options:
- Last 7 days;
- Previous week or previous month;
- Last 30 days;
- Previous year;
- This year;
- All time.
Onlypult Analytics simplifies current data analysis and gives you an understanding of your account’s further development. Learn more about the Analytics here.

With Onlypult, save time you spend on SMM tasks — posting to all social media, analytics, multiple links, micro landing pages, web monitoring. All in one place.