
We have launched Analytics for Facebook accounts. Now, you will get clear and convenient graphs with data you can share with your colleagues and clients.
Facebook Analytics works similarly on Instagram accounts already in operation on the Onlypult platform. Analytics helps adjust and optimize the promotion strategy and advertising campaigns and provides clear work reports.
Let’s talk about this tool.
Main features of Onlypult Analytics
1. Ability to customize charts for yourself. Select the parameters for collecting statistics in the Profile, Audience, Posts, and Optimization sections. All the necessary information will appear on the main page: only the indices you need and not everything in one go. Drag and drop graphs and prioritize to see all the statistics on one screen instead of navigating through various tabs and searching for the desired index.
2. Analytics is part of the platform. Yes, you have already paid for Analytics when you subscribed to Onlypult, so there will be no additional costs.
3. Option to provide access to clients and colleagues in account settings.
4. Downloading reports in XLS and PDF. You can also set up sending on a schedule (starting from the SMM plan).
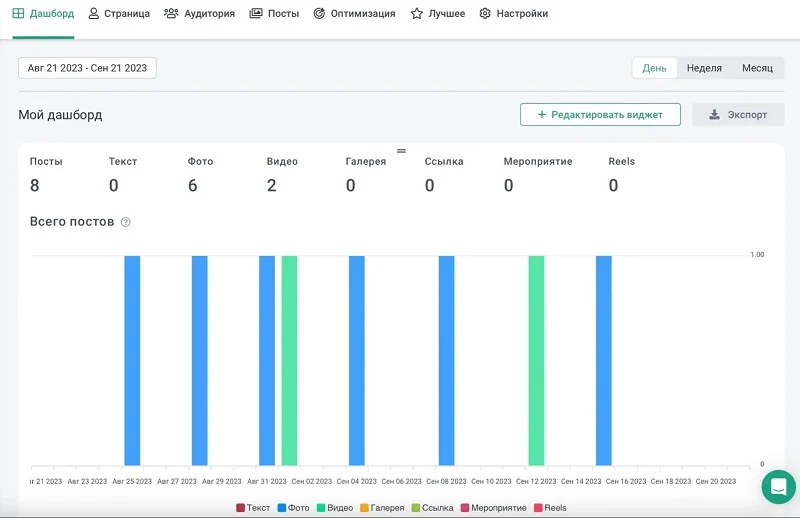
5. Data from your Facebook account is available for the entire validity period. See how the audience has changed. The number of posts is also broken down by type for your convenience.
Analytics Sections
1. Dashboard. It is the main working panel, where all graphs are displayed on one screen. You can choose a convenient display format: day, week, or month. Using the Edit widget button, customize the display for each tab: Profile, Audience, Posts, and Optimization. You can also quickly create a report by clicking the Export button.
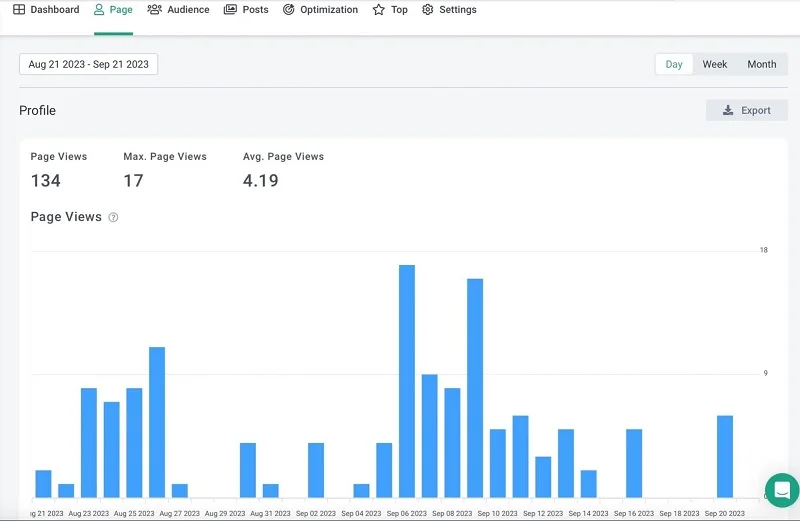
2. Page (Profile). The section provides information on the audience’s interaction with the Facebook page — reach, impressions, visits, profile views, etc.
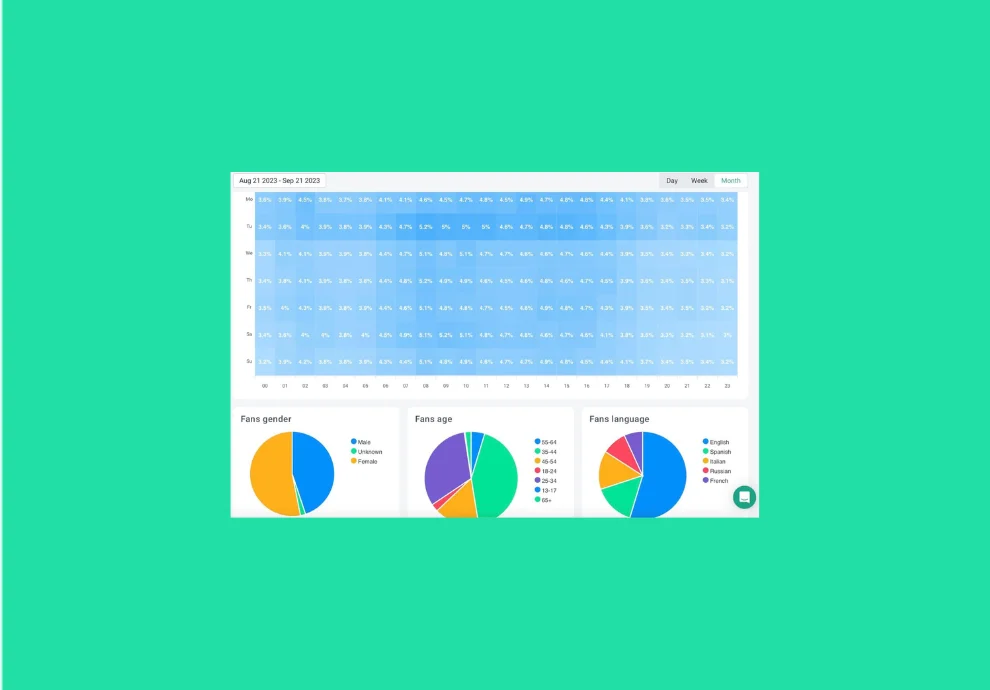
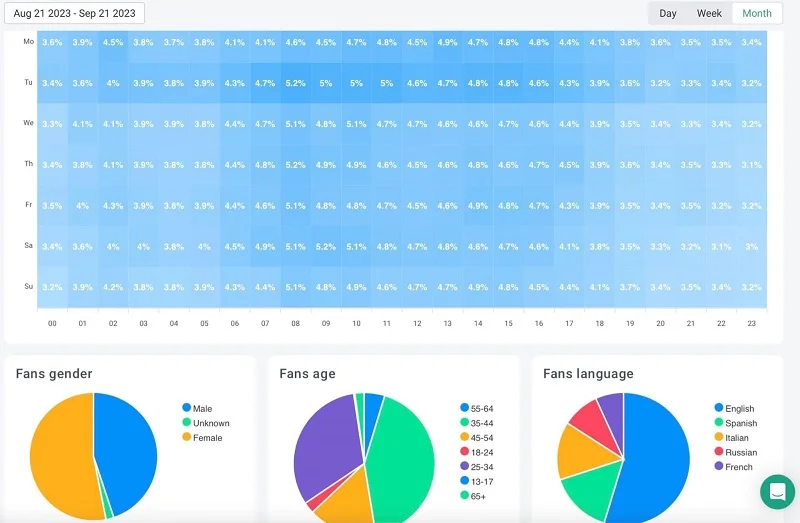
3. Audience. Shows various characteristics of the audience: number, height, activity by hour, distribution by country, gender, age, and language. You can analyze multiple graphs at the same time.
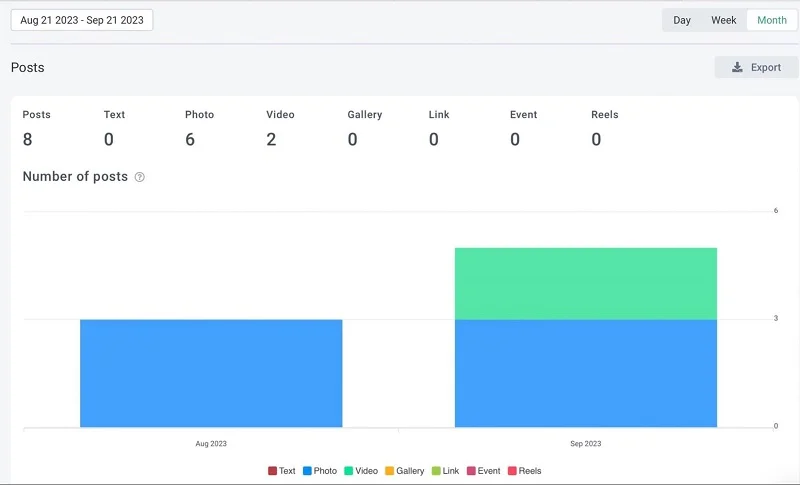
4. Posts. All statistics on posts: views, likes, comments, reactions, breakdown by type (photo, video, gallery, reels), engagement rate, reach, and more.
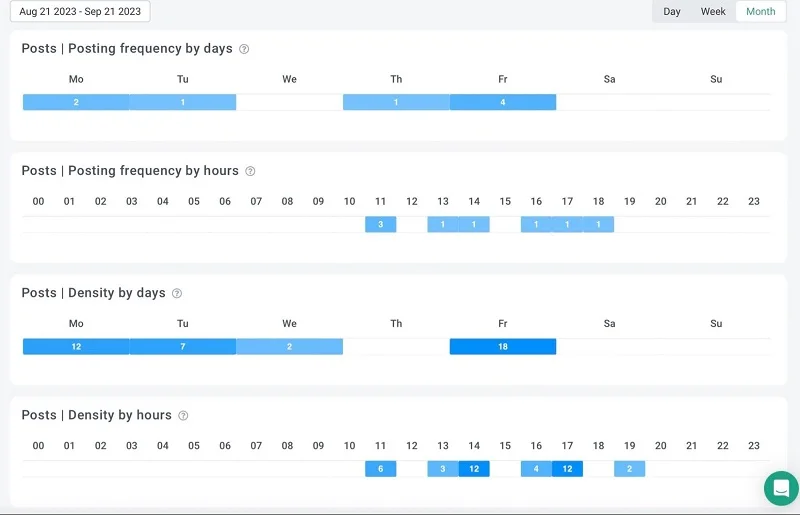
5. Optimization. In this section, you can see the best time to publish, frequency of publications, density by day and hour, top hashtags, the most engaging types of posts, and much more.
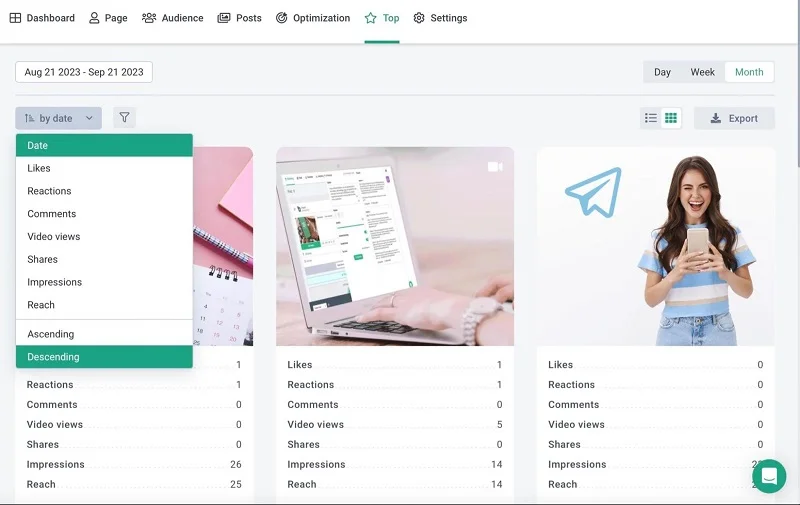
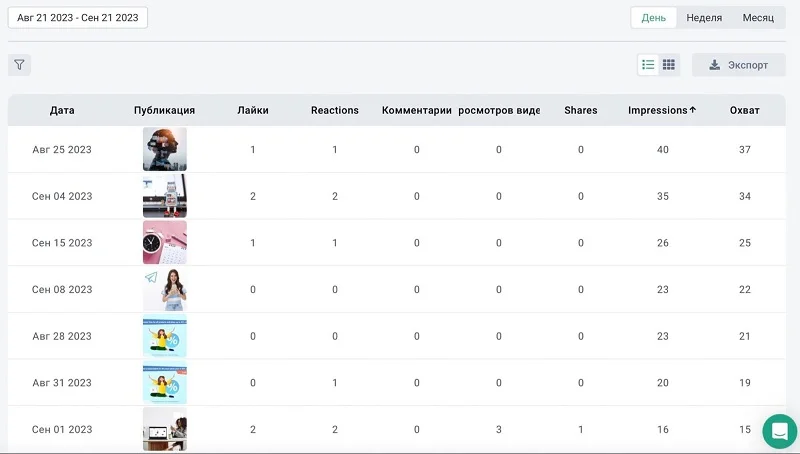
6. Top posts. A section with content statistics, that shows the most successful publications and stories by reach, number of comments, video views, likes, and saves — and only in one click.
There are two types of display: list and grid. In the list view, you can sort the top posts by clicking on the column heading.
We are planning to add new social networks shortly to make your experience even more convenient.

With Onlypult, save time you spend on SMM tasks — posting to all social media, analytics, multiple links, micro landing pages, web monitoring. All in one place.