
LinkedIn is one of the leading media business platforms, especially for the b2b segment.
This article gives tricks on how to improve brand page effectiveness by tracking analytics. This work should become an integral part of the strategy on this social platform.
Preparing for posting on LinkedIn
When you develop a marketing strategy for LinkedIn, think about the primary goals: to increase brand awareness, strengthen the company’s reputation, grow sales, and create a conversion page to generate leads.
Make sure you fill in all the profile information. Ensure people can read all vital brand information immediately. Users shall not guess what the company’s specialization is and where it is located. LinkedIn asks relevant questions when you create a page — answer them.
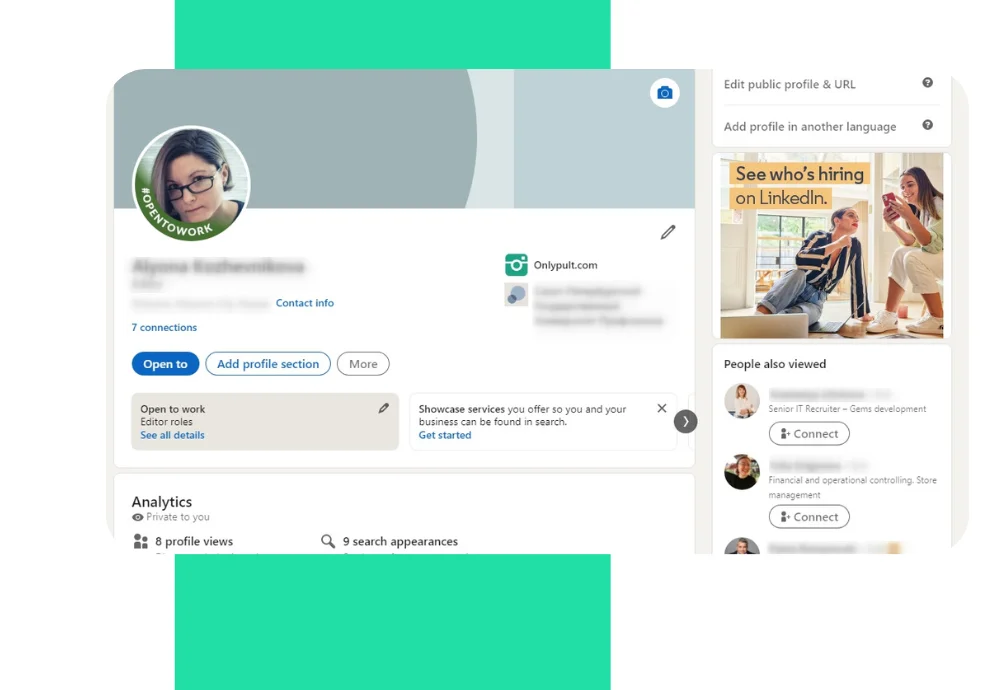
A short data summary is always visible on the left of the main page.
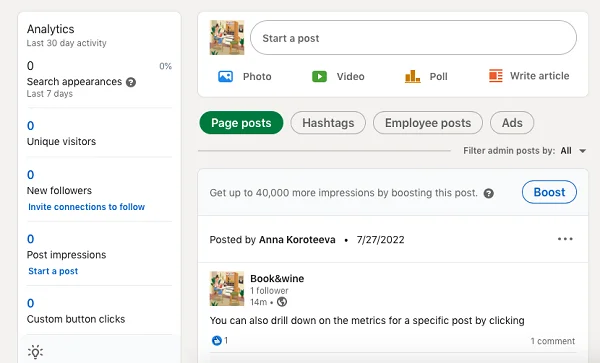
5 categories of metrics are displayed on the LinkedIn platform:
- Followers
- Profile Content
- Visitors
- Competitors
- Employee engagement
LinkedIn’s Internal Analytics Tools
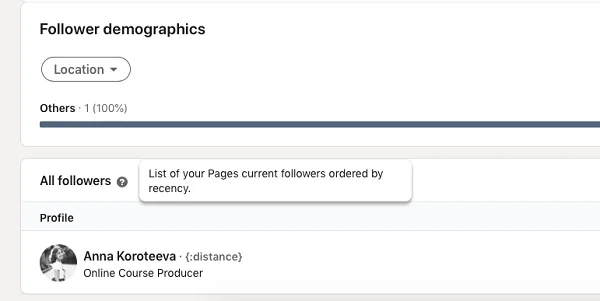
Followers
They are users who interact with content and page updates.
Detailed information about followers will help when creating a content plan: it allows you to address the audience directly and choose a certain TOV (tone of voice), — which increases engagement.
In analytics, you will see the profiles of those subscribed to the page, and you will be able to analyze all the necessary parameters: positions, work experience, and industry. The total number of subscribers is updated once a day.
Analytics of profile posts
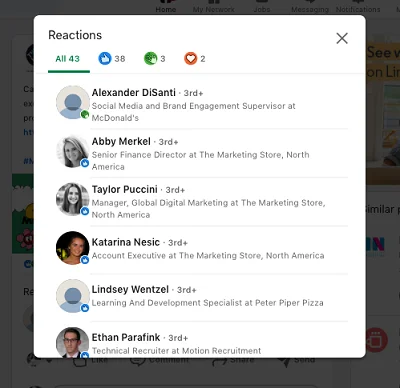
There are several ways to view reaction information — likes, comments, and engagement.
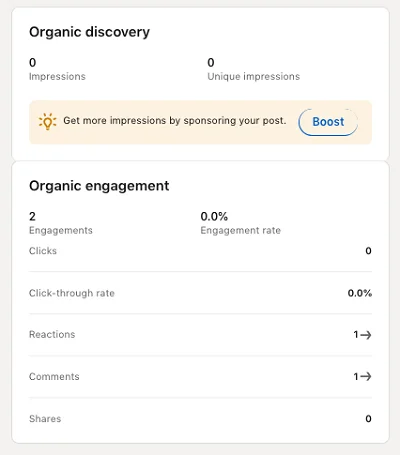
General statistics. In this section, the administrator selects the date and sees the data on this metric.
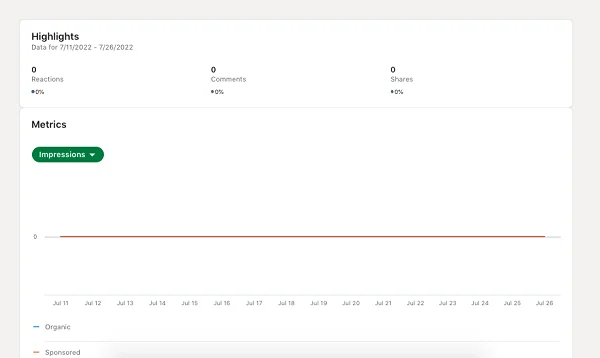
Engagement coefficient. This metric is calculated using the following algorithm: the number of clicks is divided by the number of impressions.
Did a user click? The call to action worked. If the CTR drops, you should carefully develop the logic and structure of posts.
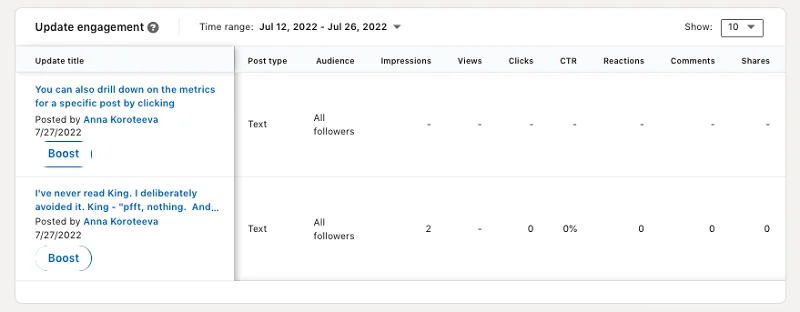
Specific publications in the feed. Check which of the users exactly put this or that reaction — right under the posted content.
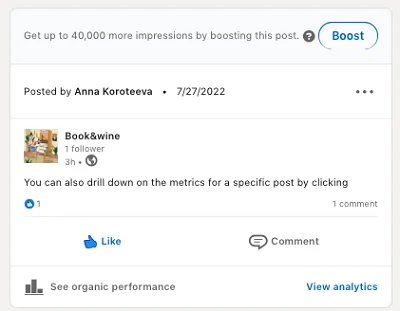
You get organic and advertising traffic information displayed by clicking on a post from the admin account.
Visitors
Statistics show who visited the page but did not subscribe. The availability of these data will allow us to identify patterns — which posts bring a surge of interest and which lead to a decrease. Adapt the published content accordingly.
One task of LinkedIn as a marketing tool is to turn visitors who got to the page into followers.
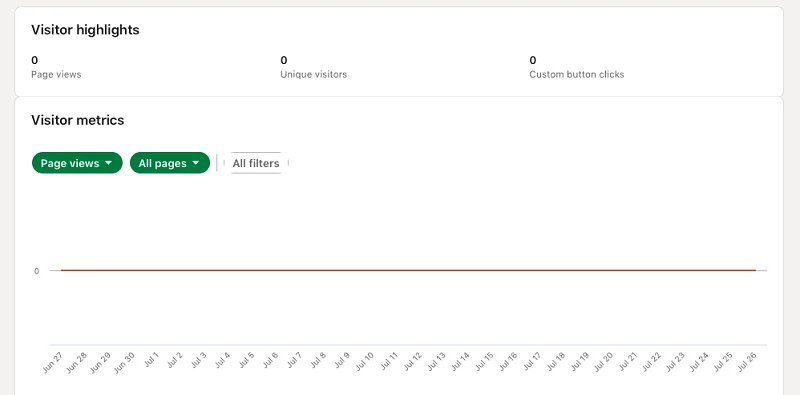
Clicks on the following buttons on your profile: Register, Contact us, and Details — those that the company provided. The metric shows how many clicks were made on them over a particular time.
Competitor Analytics
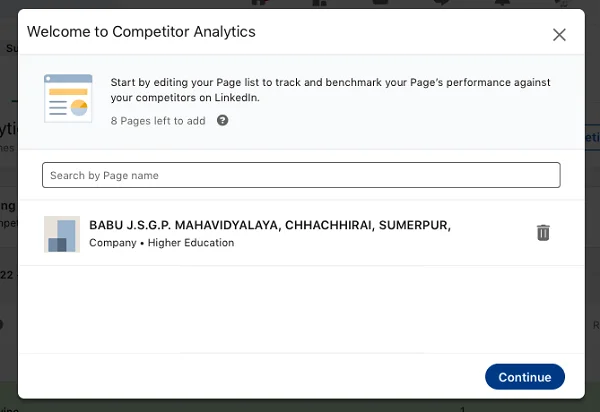
The platform functionality allows you to edit the competitor list to track specific pages on LinkedIn. To do this, go to the Analytics tab, then — Competitors.
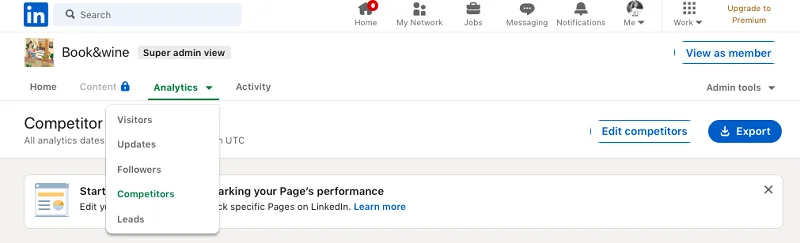
Then enter the names of the required pages — maximum 9.
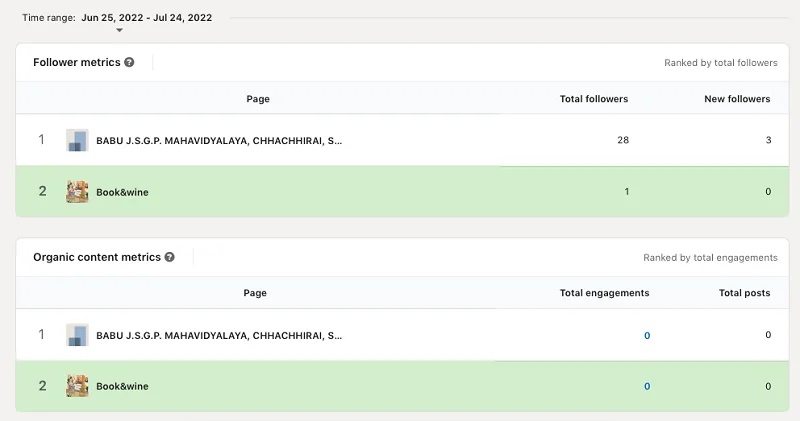
The algorithms make comparisons on several indicators for the date you have chosen.
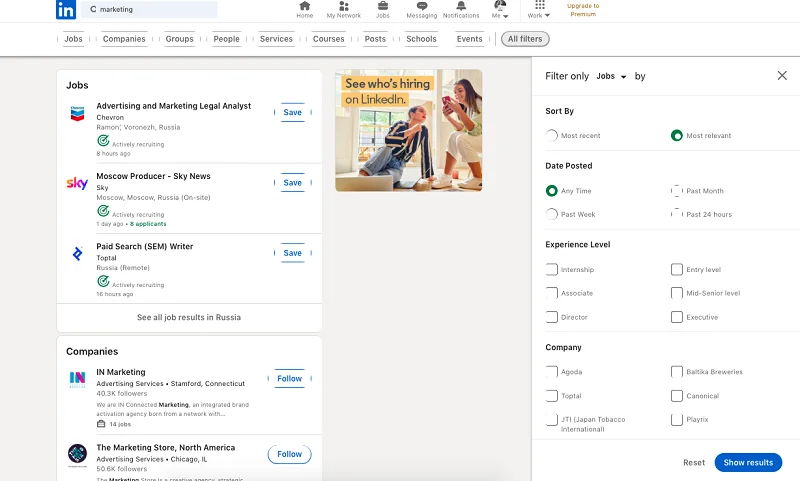
You can also manually analyze competitor pages: enter the topic of interest in the search and select the pages. It will allow you to study in more detail what companies are present on LinkedIn and what content they publish.
Employee engagement
Track how the activity of the company’s employees results in the improvement of page indicators.
Encourage employees who regularly update their personal LinkedIn pages. For example, if they run expert blogs and are active on the site.
However, this is not the most crucial index to remember when forming a strategy if you have just started to run a page.
How to put analytics data into practice
Adapt the content plan
The indices show to what extent the content posted on the LinkedIn page is interesting to followers. It is easier to identify particular patterns and draft an action plan by analyzing analytics data regularly.
Example. If posts gain few reactions again and again, and engagement rates fall, you can go for a new strategy and test it: change the time of publication of posts, add video content, if there were only text materials before.
Conduct target audience research
Profiles of the page’s active audience are a potential field for research: the more followers, the more opportunities to find vivid insights about a part of the target audience.
Example. Poll the followers to collect quantitative data or ask them to give an interview for a bonus or discount.
Monitor competitors
Competitor analysis helps to adjust long-term SMM planning. If you see the target audience reacting to other content formats, it is worth considering a more flexible content plan.
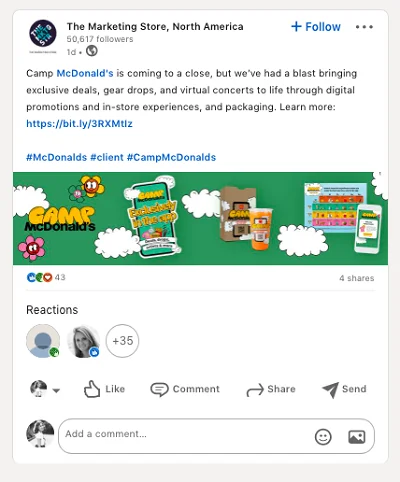
Example. Competitors publish various posts: polls, photos, videos, and links to articles commented on by the company’s experts. Try to adapt the news hooks from the initial content plan to other types of content.

To stay ahead of your competitors, start monitoring mentions of them on social media and interact with their customers. A free plan is available.
LinkedIn metrics show the effectiveness of an account. Use the data and figures got to optimize the marketing strategy further.
It is indices that are crucial in determining which content will resonate with the target audience — it helps to improve your performance profile significantly.